
Reports — User Manual
Also searched as: analytics, export data, download report, business intelligence, financial report, reconciliation report, matching report, variance report, operator performance report, app usage report, users report.
Reports
Open Reports from the main menu (requires the Report Access permission) and choose the report you need from the sidebar. Every report follows the same basic pattern: pick your filters, click Generate (or Refresh), then read the KPI cards, charts, and tables — or export the result.

Which reports your plan shows. The Consignment Report, the Financial Report and the Business Partner Report are made from consignments, so they are part of the Tree and Forest plans. On Seedling and Sapling they are not listed in the Reports menu. The other reports (Stock Unit, Tally, Product, Location and so on) are available as your plan allows.
Report Filters
Most reports have a From / To date range. A few add extra filters specific to that report (search a partner, pick a trade type or status, type a currency code). Details for each report are below.

Change your filters, then click Generate or Refresh to load the data. Wait for the KPI cards, charts, and tables to finish loading before exporting.

Exporting Reports
Most reports show Excel and PDF buttons in the header once a report has loaded. Use Excel for further analysis and PDF for sharing a printable report with management, buyers, suppliers, or operations teams.

Export buttons only appear if you hold the Report Export permission — if you don’t have it, they simply don’t show. A few reports are Excel-only (no PDF), and two reports (Users, App Usage/Analytics) have no export option at all — see each report’s section below for what’s actually available.
Business Partner Report
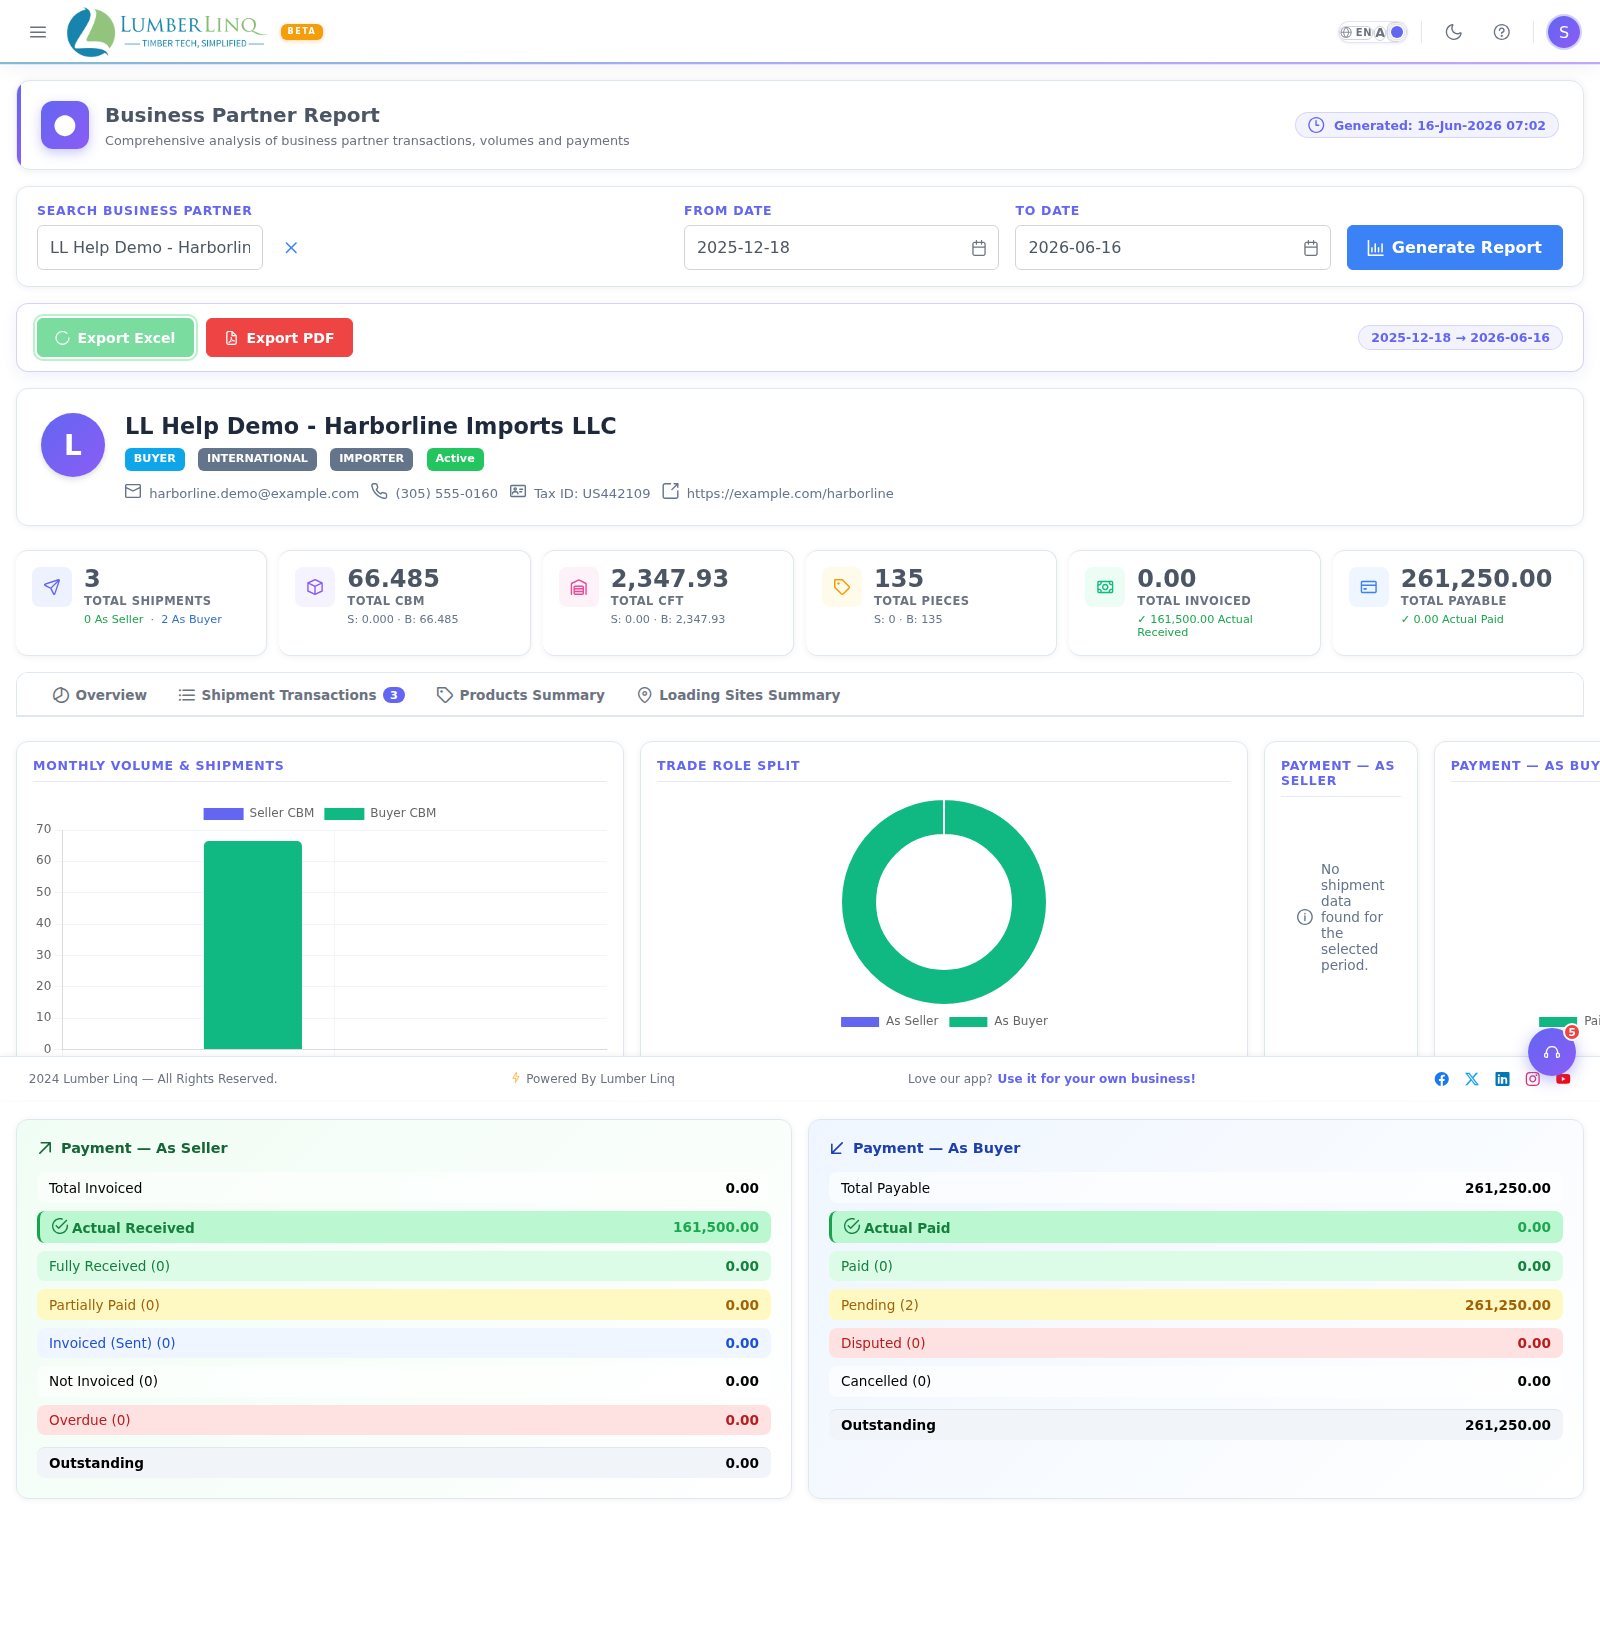
Go to Reports > Business Partner. This report is per-partner: search for a specific buyer, seller, shipper, or consignee by name using the autocomplete box, then pick a date range. Generate stays disabled until a partner is selected.
The report opens with a profile card (partner name, avatar, party type tag, category, registration type, active/inactive status, country, email, phone, tax ID, website), then KPI cards for Total Shipments (split into as-Seller / as-Buyer), Total CBM, Total CFT, Total Pieces, Total Invoiced, and Total Payable. If the partner’s shipments span more than one currency and an exchange rate is missing for any of them, the blended total shows a dash instead of a misleading number.
Four tabs go deeper:
- Overview — monthly volume chart, trade-role split, seller/buyer payment-status pie charts, and a full payment breakdown (received, partially paid, invoiced, not invoiced, overdue, outstanding) for both sides of the relationship.
- Transactions — every shipment with this partner: date, role, trade type, port of loading/discharge, currency, invoice amount, CBM, CFT, pieces, payment status, BL number, and status.
- Products — which products moved through this partner, with CBM/CFT/pieces/unit/shipment totals per product.
- Loading Sites — the same breakdown by loading site.
Product Report
Go to Reports > Product. Filter by date range and click Generate.
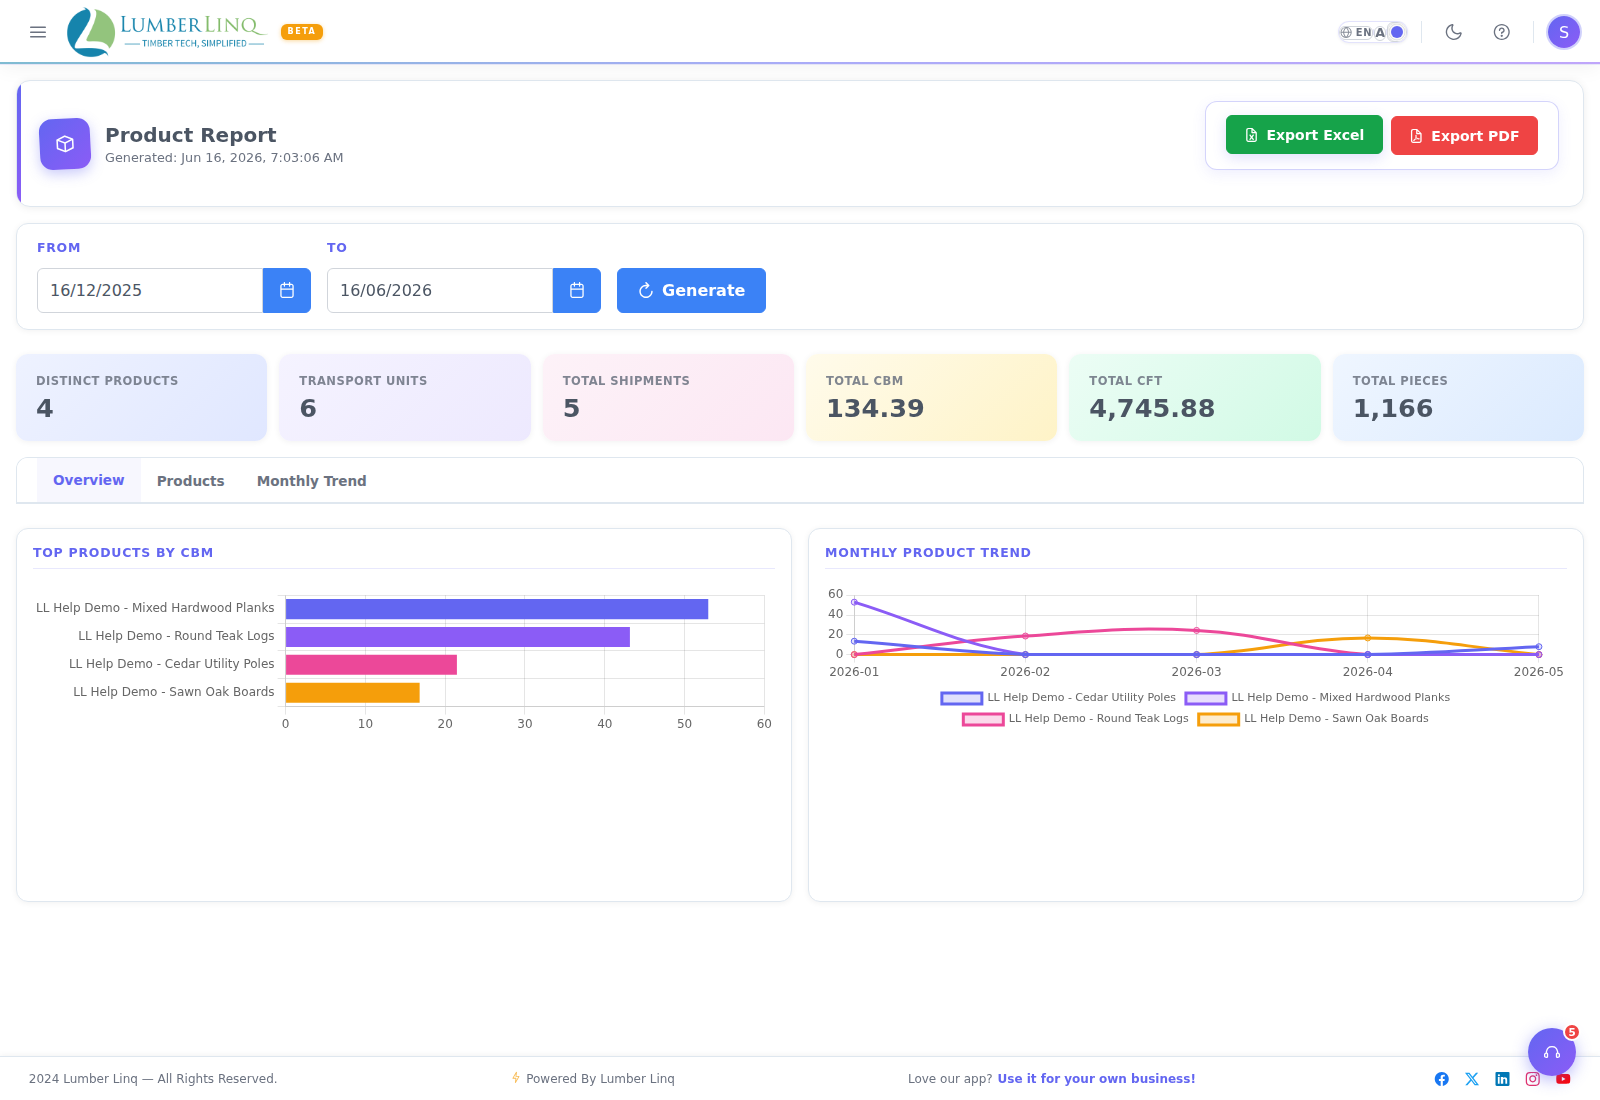
KPI cards show Distinct Products, Stock Units, Total Shipments, Total CBM, Total CFT, and Total Pieces. Three tabs:
- Overview — Top Products by CBM chart and a Monthly Product Trend line chart.
- Products — a table per product (name, HS code, CBM, CFT, pieces, Stock Unit count, shipment count, average CBM per unit, top partners, top loading sites). If your account has the Inventory module enabled, a Current Stock column is also shown.
- Monthly Trend — the same figures broken down by month and product.
Location Report
Go to Reports > Location (older links may still say “Loading Site”). Filter by date range and click Generate.
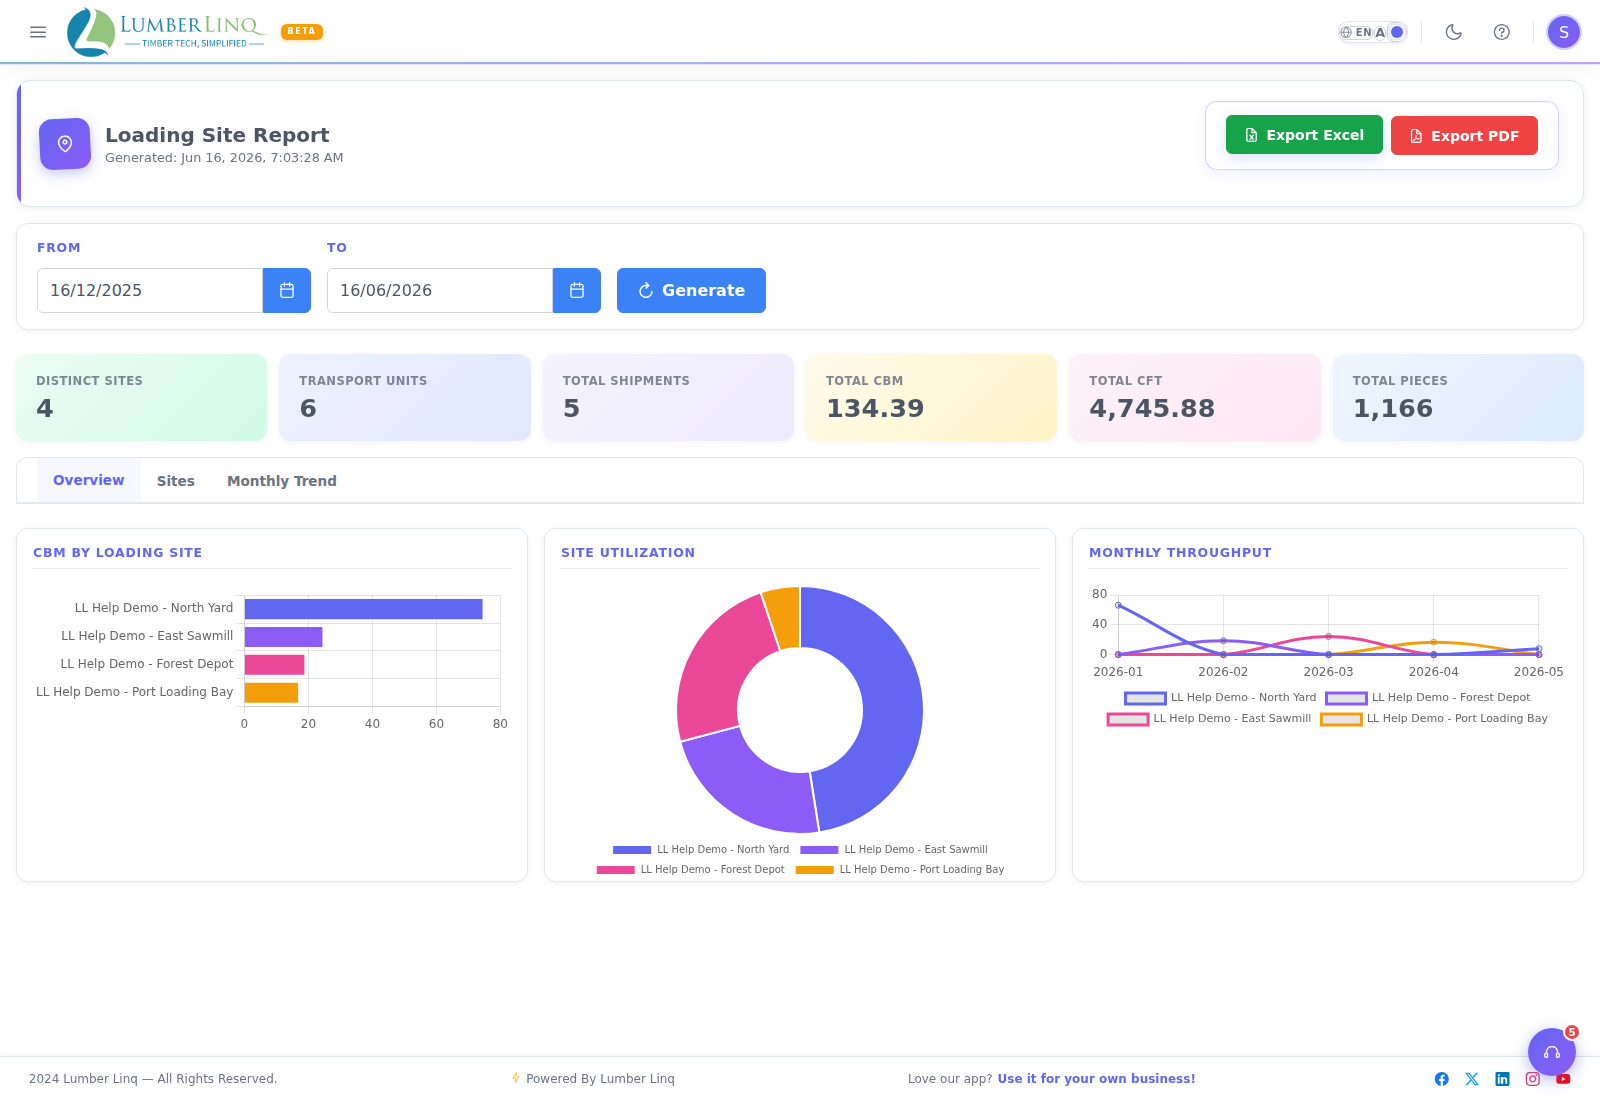
KPI cards show Distinct Sites, Stock Units, Total Shipments, Total CBM, Total CFT, and Total Pieces. Three tabs:
- Overview — CBM by site chart, a capacity-utilization doughnut, and a monthly trend line chart.
- Sites — a table per site (name, location, capacity, CBM, CFT, pieces, unit count, shipment count, utilization %, top products). If Inventory is enabled, a Mill Throughput column also appears.
- Monthly Trend — the same figures broken down by month and site.
Stock Unit Report
Go to Reports > Stock Unit (older links may still say “Transport Unit”). Filter by date range and click Generate.
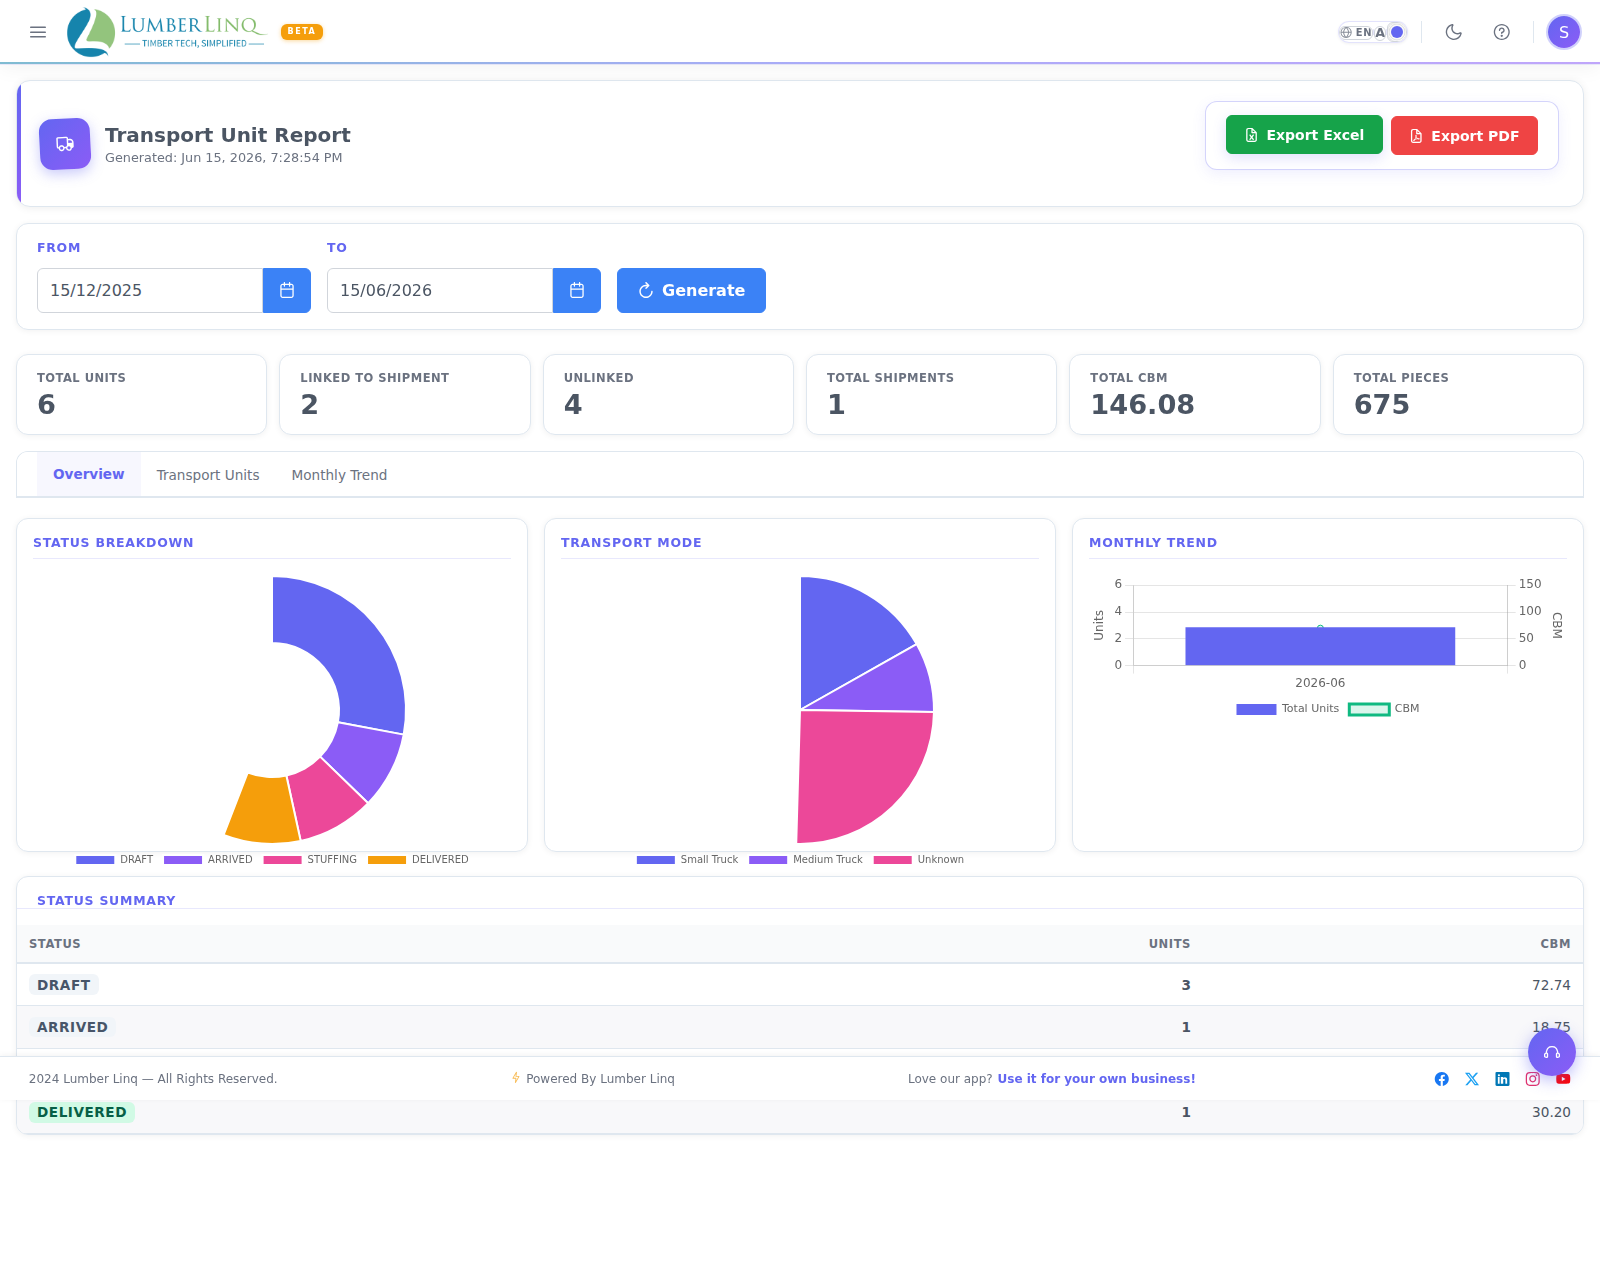
KPI cards show Total Units, Linked to Consignment, In Stock (units sitting as available/in-process inventory — not counted as “unlinked” since they’re healthy on-hand stock, not orphaned records), Unlinked, Total Shipments, Total CBM, and Total Pieces. Three tabs:
- Overview — a status-breakdown doughnut, a transport-mode pie chart, a monthly trend chart, and a status summary table.
- Units — every Stock Unit (transport ID, unit number, status, mode, product, site, linked shipment, CBM, pieces, utilization %, created date).
- Monthly Trend — the same figures broken down by month.
Tally Report
Go to Reports > Tally. Filter by date range and click Generate.
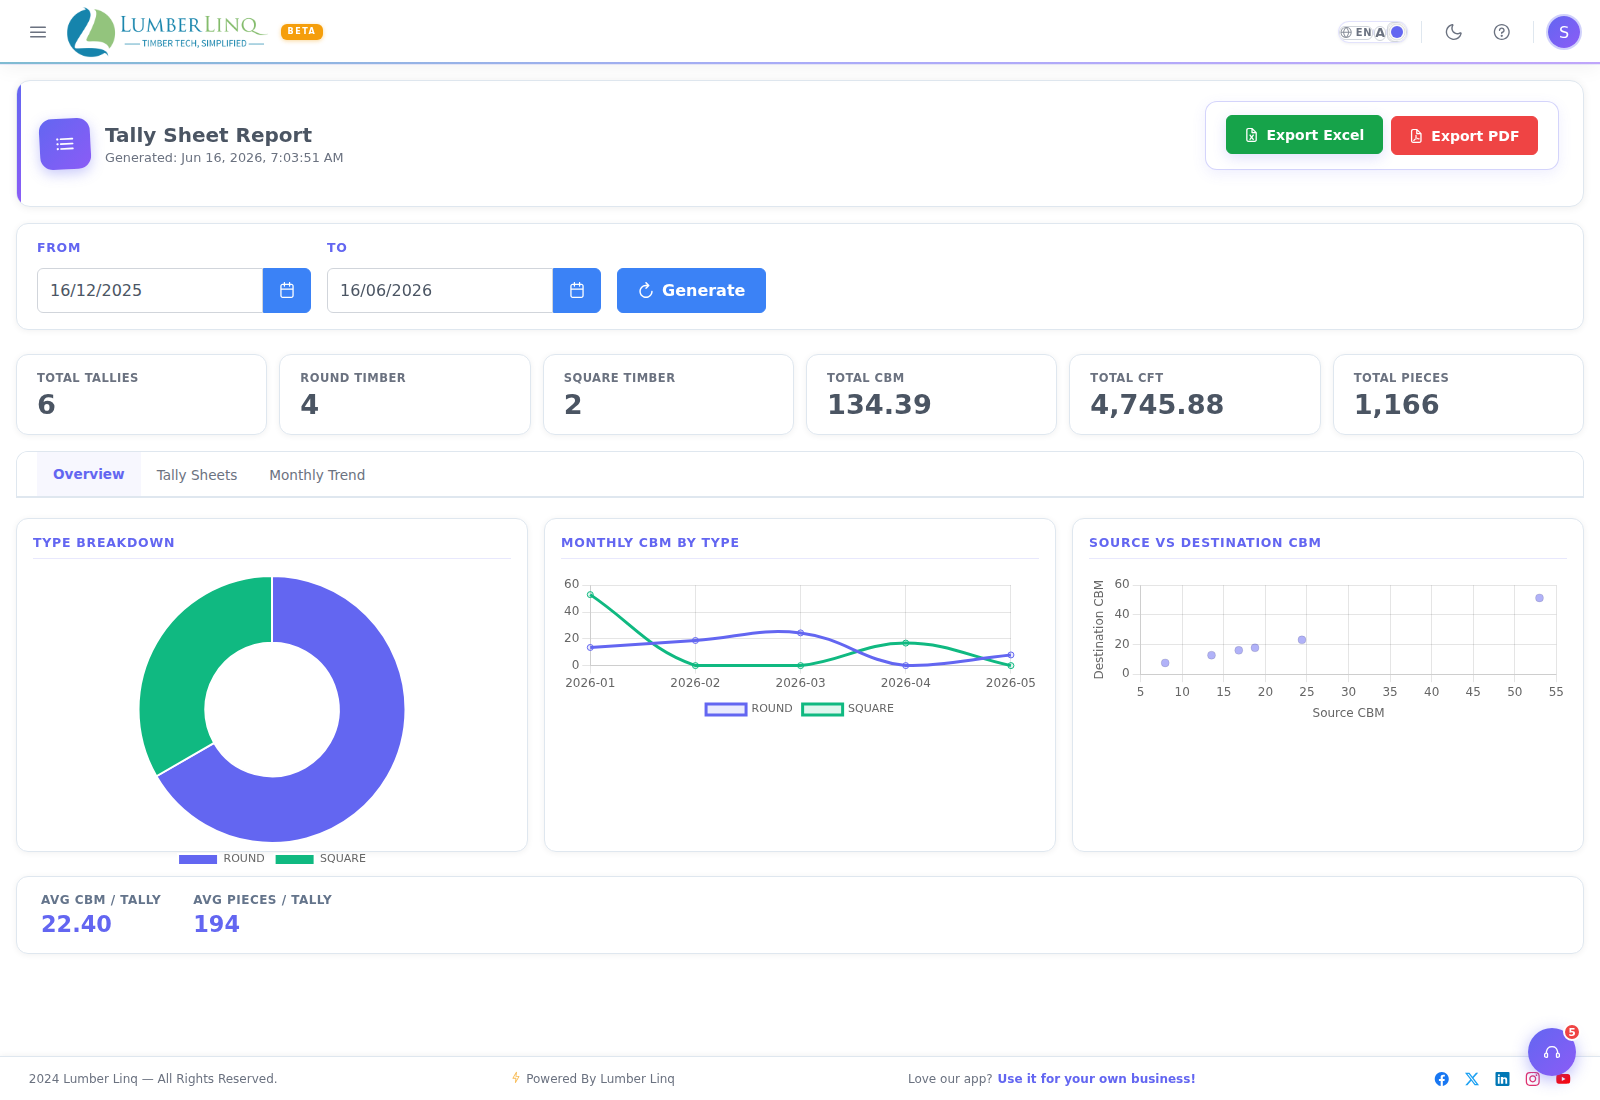
KPI cards show Total Tallies, Round Tallies, Square Tallies, Total CBM, Total CFT, Total Pieces, and (when present) a Flexible Grid count for tallies created with the Square flexible-view grid style. Three tabs:
- Overview — Round vs Square split, a monthly CBM trend line, a shrinkage scatter chart, plus average CBM and average pieces per tally.
- Tallies — every tally (type, transport ID, unit number, product, site, linked shipment, CBM, pieces, destination CBM, shrinkage %, created date).
- Monthly Trend — the same figures broken down by month and tally type.
Reconciliation Report
Go to Reports > Reconciliation. This report compares each tally’s source measurement against its destination (post-shipment) measurement to catch shrinkage or data-entry mismatches.
This report is plan-gated — the app’s own message is “Available on Tree and above.” If your plan doesn’t include it, you’ll see an upgrade wall with a link to Subscriptions instead of the report (on the iOS app, Apple’s rules mean you’re told to contact your admin instead of a direct upgrade link).
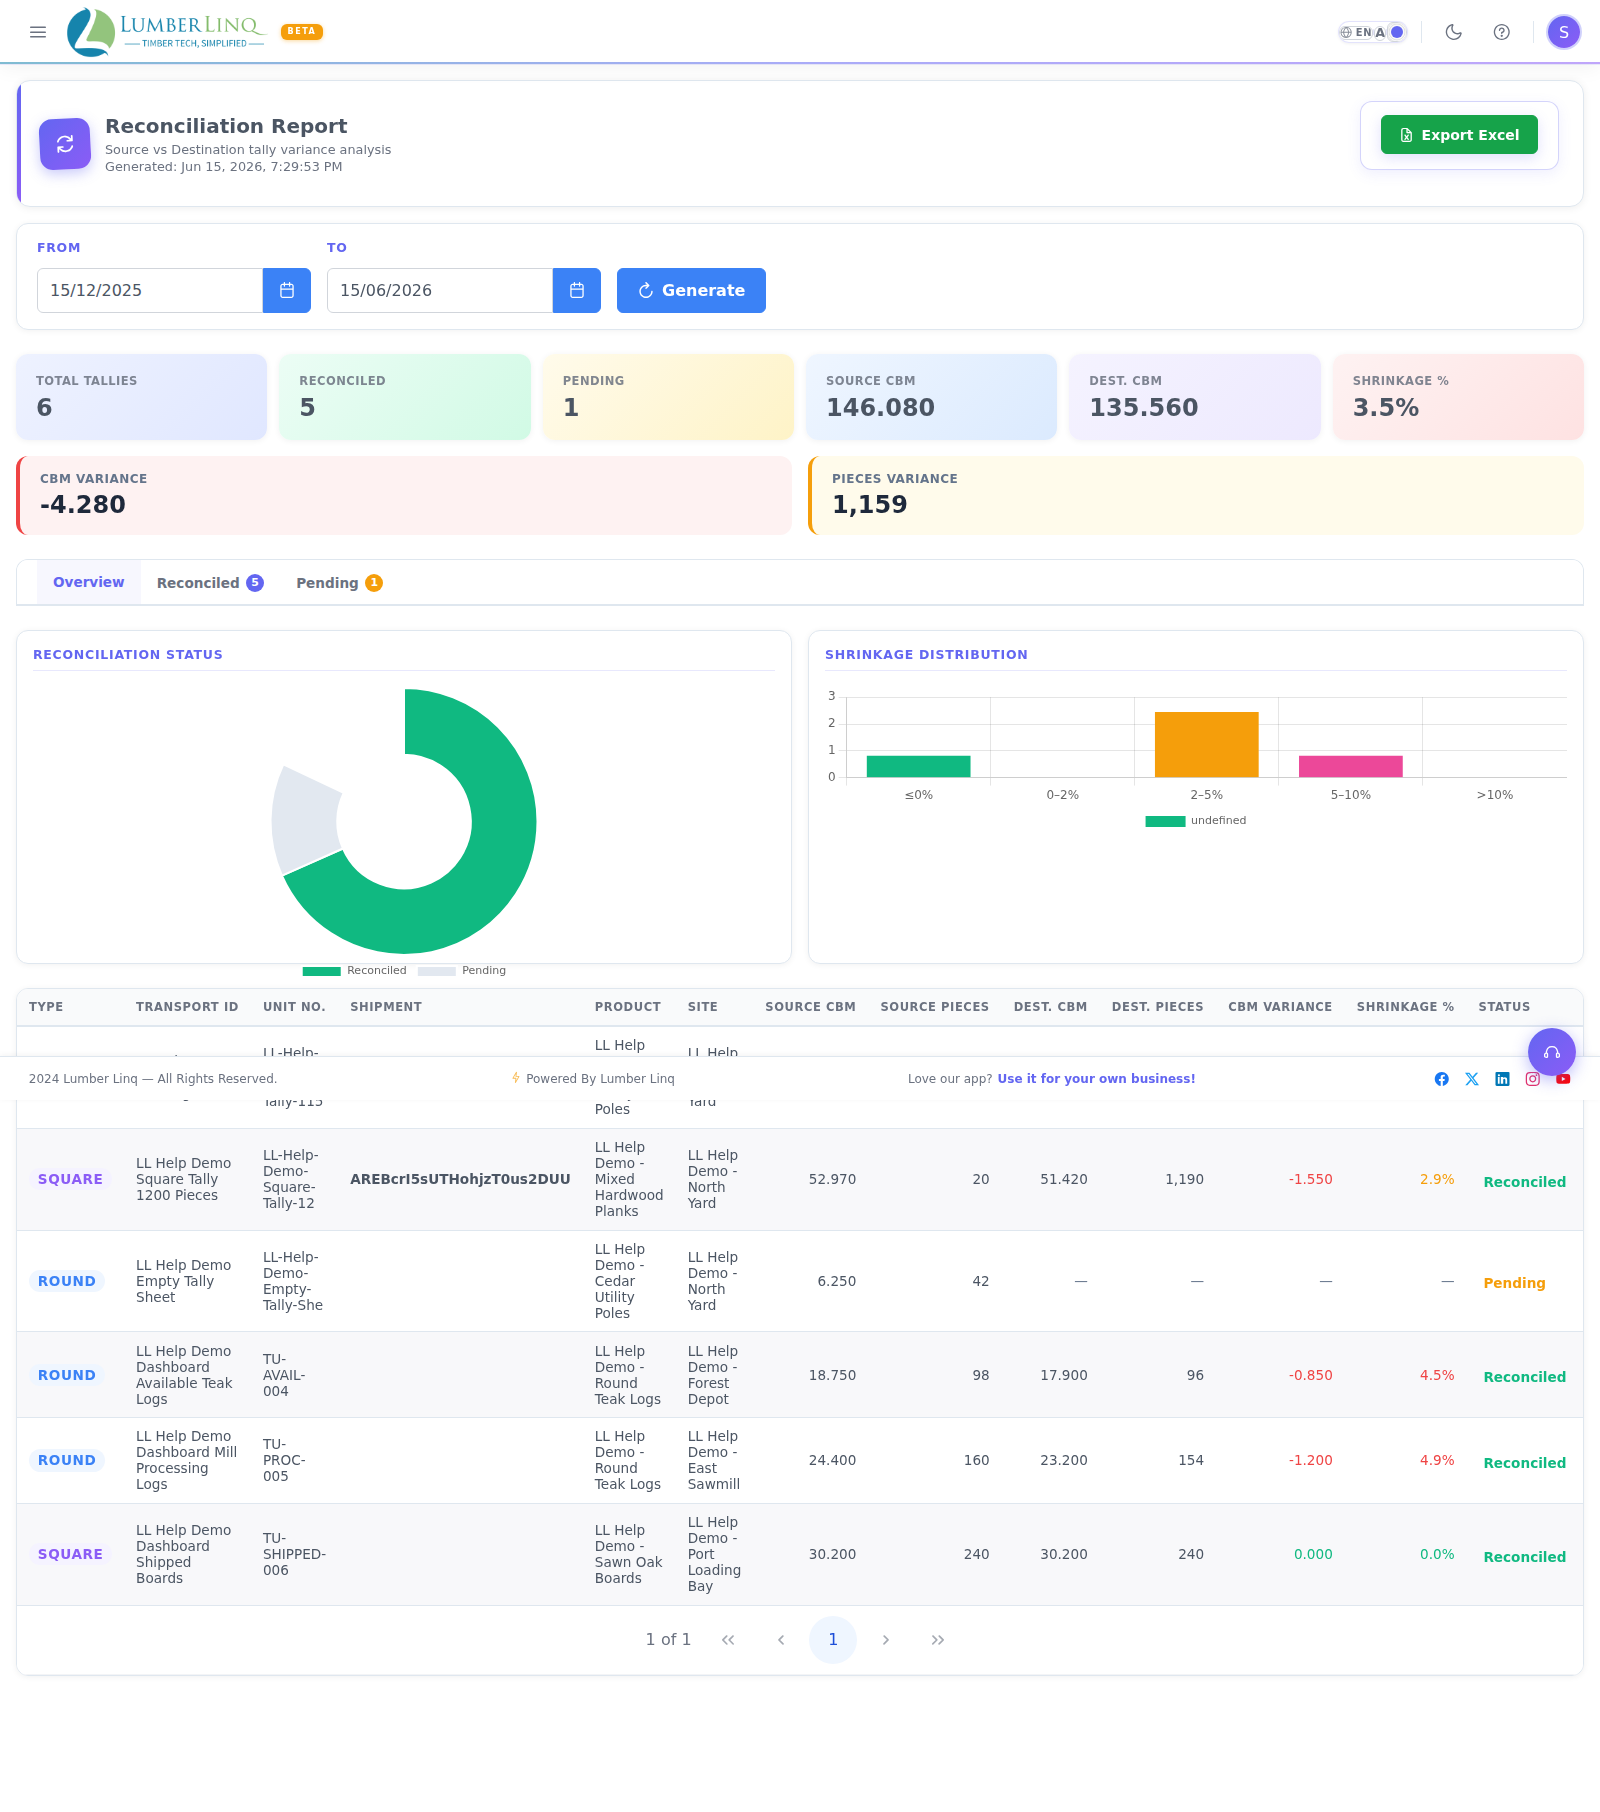
Filter by date range and click Generate. KPI cards show Total Tallies, Reconciled, Pending, Source CBM, Destination CBM, Shrinkage %, and — for tenants with the Inventory module enabled — Mill Loss CBM (legitimate re-saw conversion loss, tracked separately from shrinkage). A variance strip shows the total CBM and piece variance. Three tabs:
- Overview — a reconciliation-progress meter, a shrinkage distribution chart, and the full row-by-row table.
- Reconciled — only rows that already have both source and destination data.
- Pending — rows still waiting on a destination tally.
Export is Excel only — there’s no PDF button on this report.
App Usage Report
Labelled Analytics in the menu — go to Reports > Analytics. There’s no date filter, just a Refresh button.
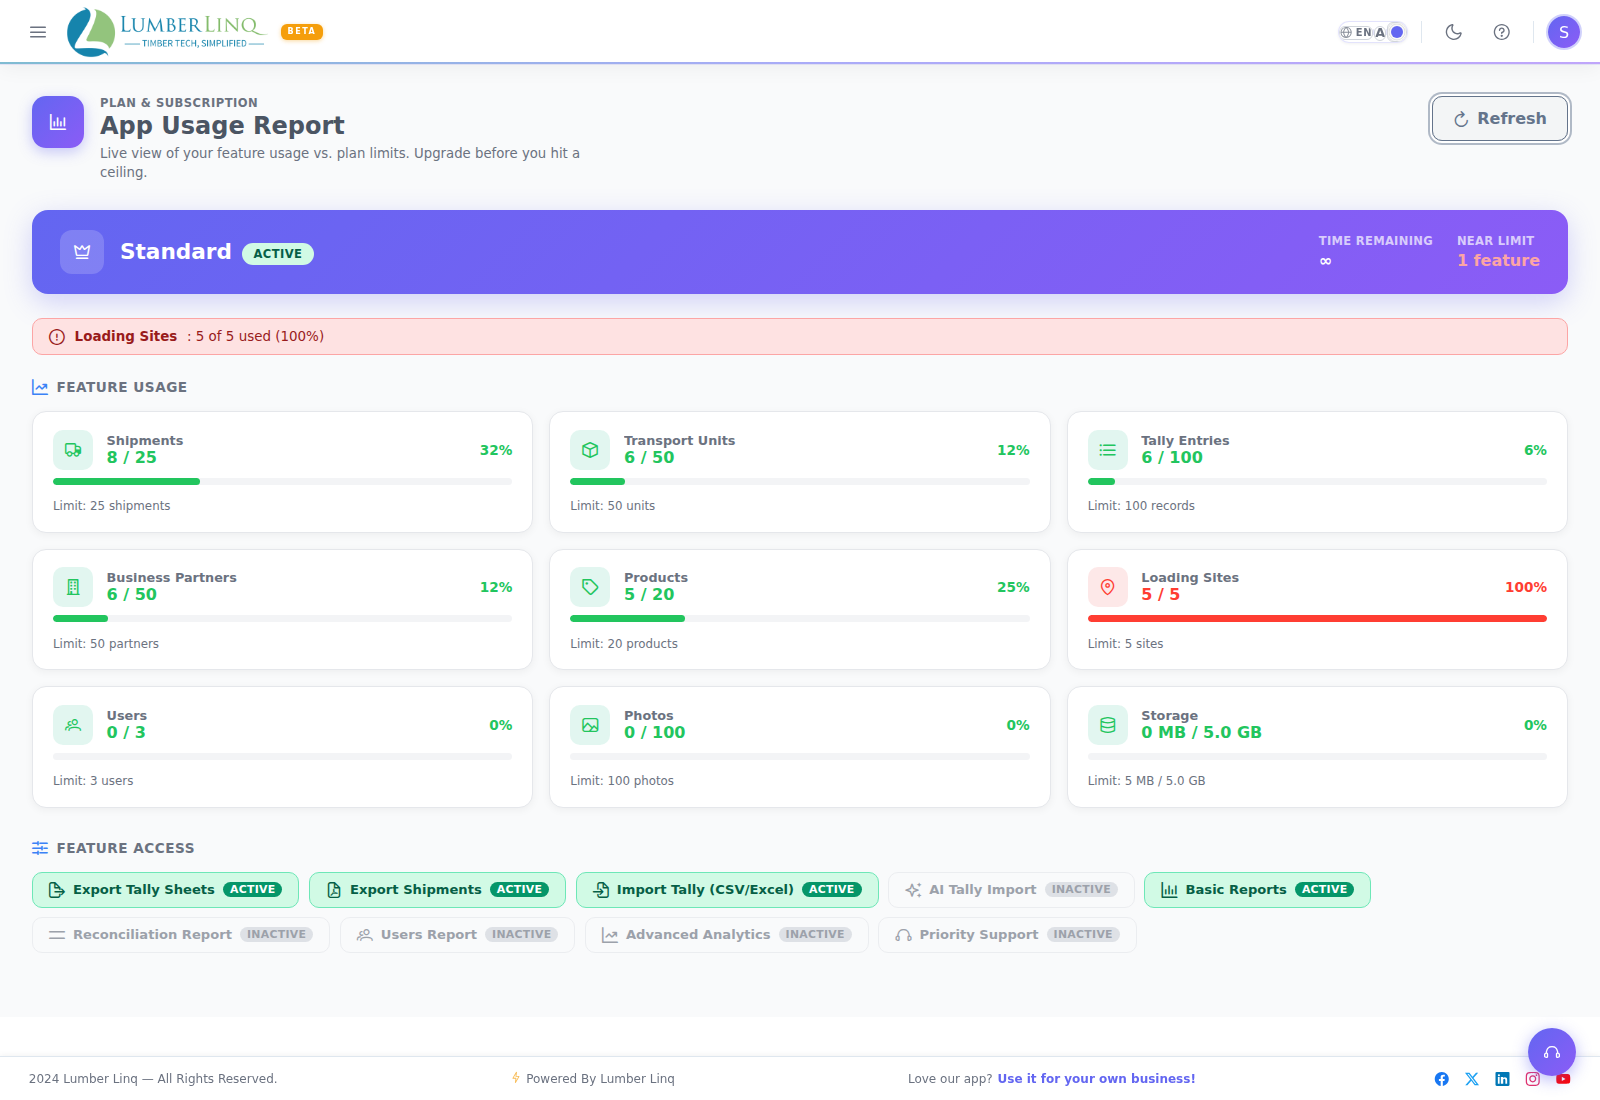
This report is about your subscription usage, not shipment data: a plan card (plan name, status, valid-till date, days remaining), an alert strip for any feature getting close to its limit, a usage grid (tallies, shipments, users, storage, AI Chat, and more — each with a progress bar, or an “Unlimited”/“Off” badge where that applies), an AI Credits usage bar, and a Feature Access section showing which platform features are turned on or off for your account.
There is no export option on this report.
Users Report
Go to Reports > Users. Like Reconciliation, this report is plan-gated — “Available on Tree and above.” — with the same upgrade wall if your plan doesn’t include it.
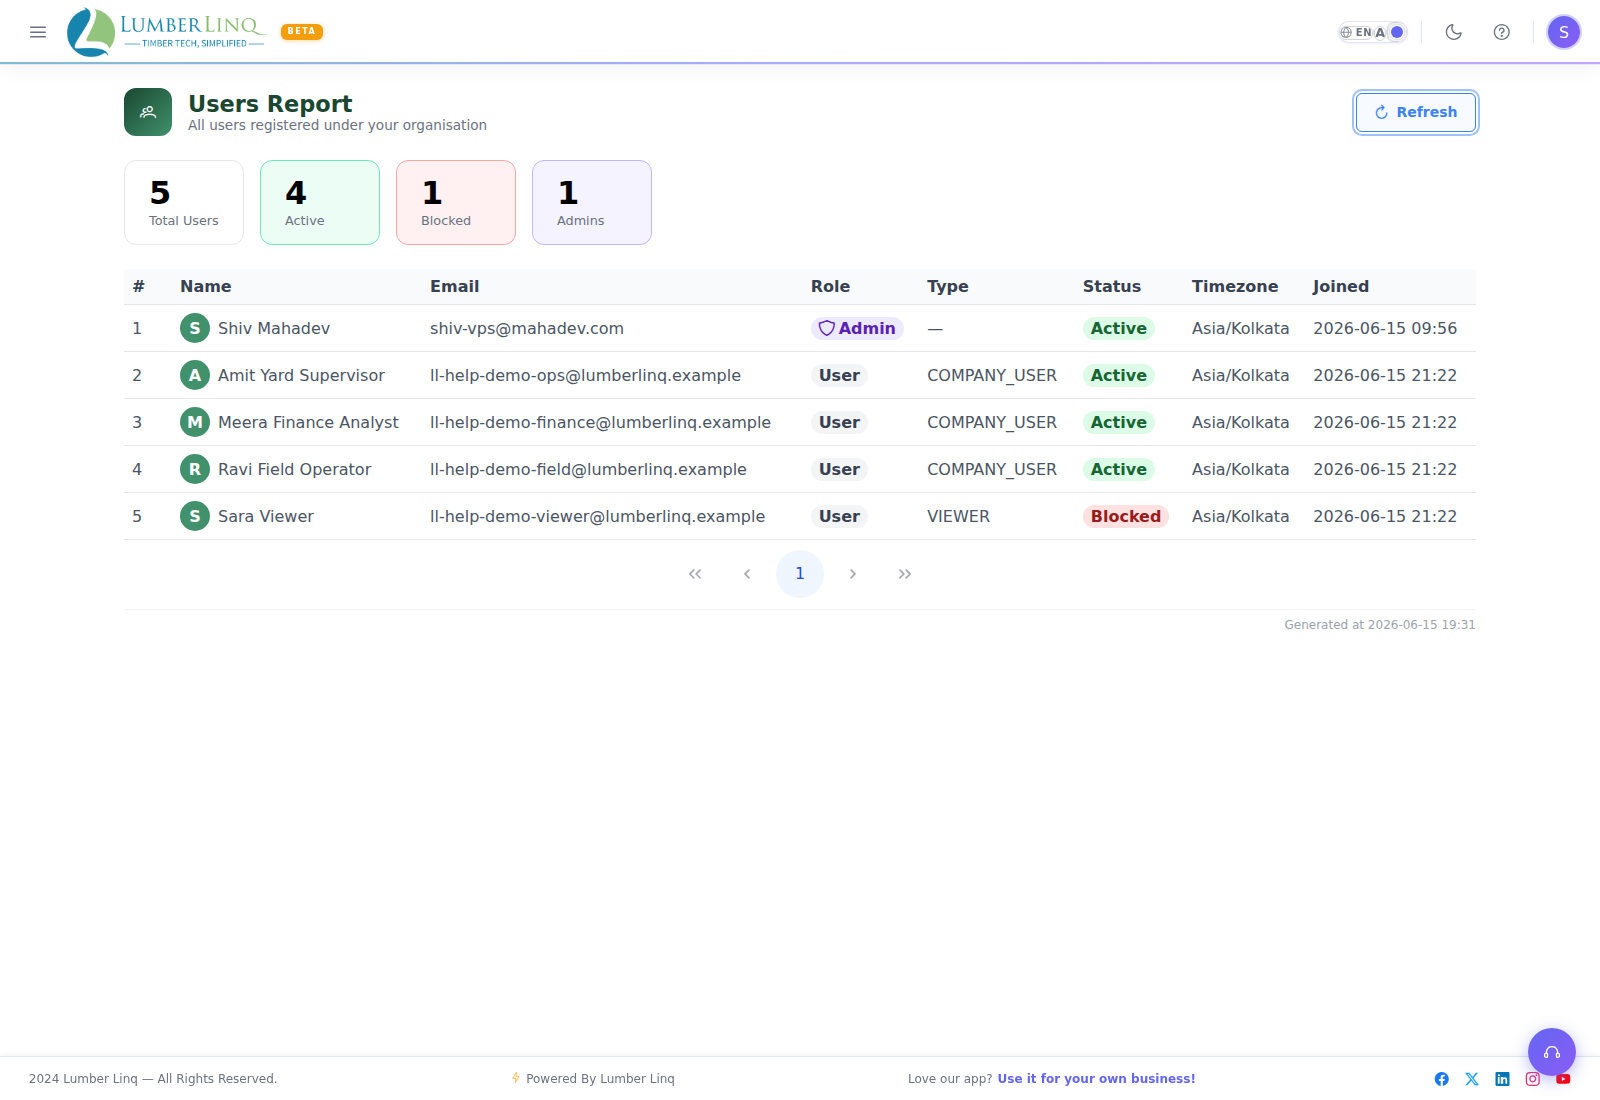
There’s no date filter, just a Refresh button. Stat cards show Total Users, Active, Blocked, and Admins. The table lists every user: name, email, role (Admin/User badge), user type, status, timezone, and joined date.
There is no export option on this report.
Consignment Report
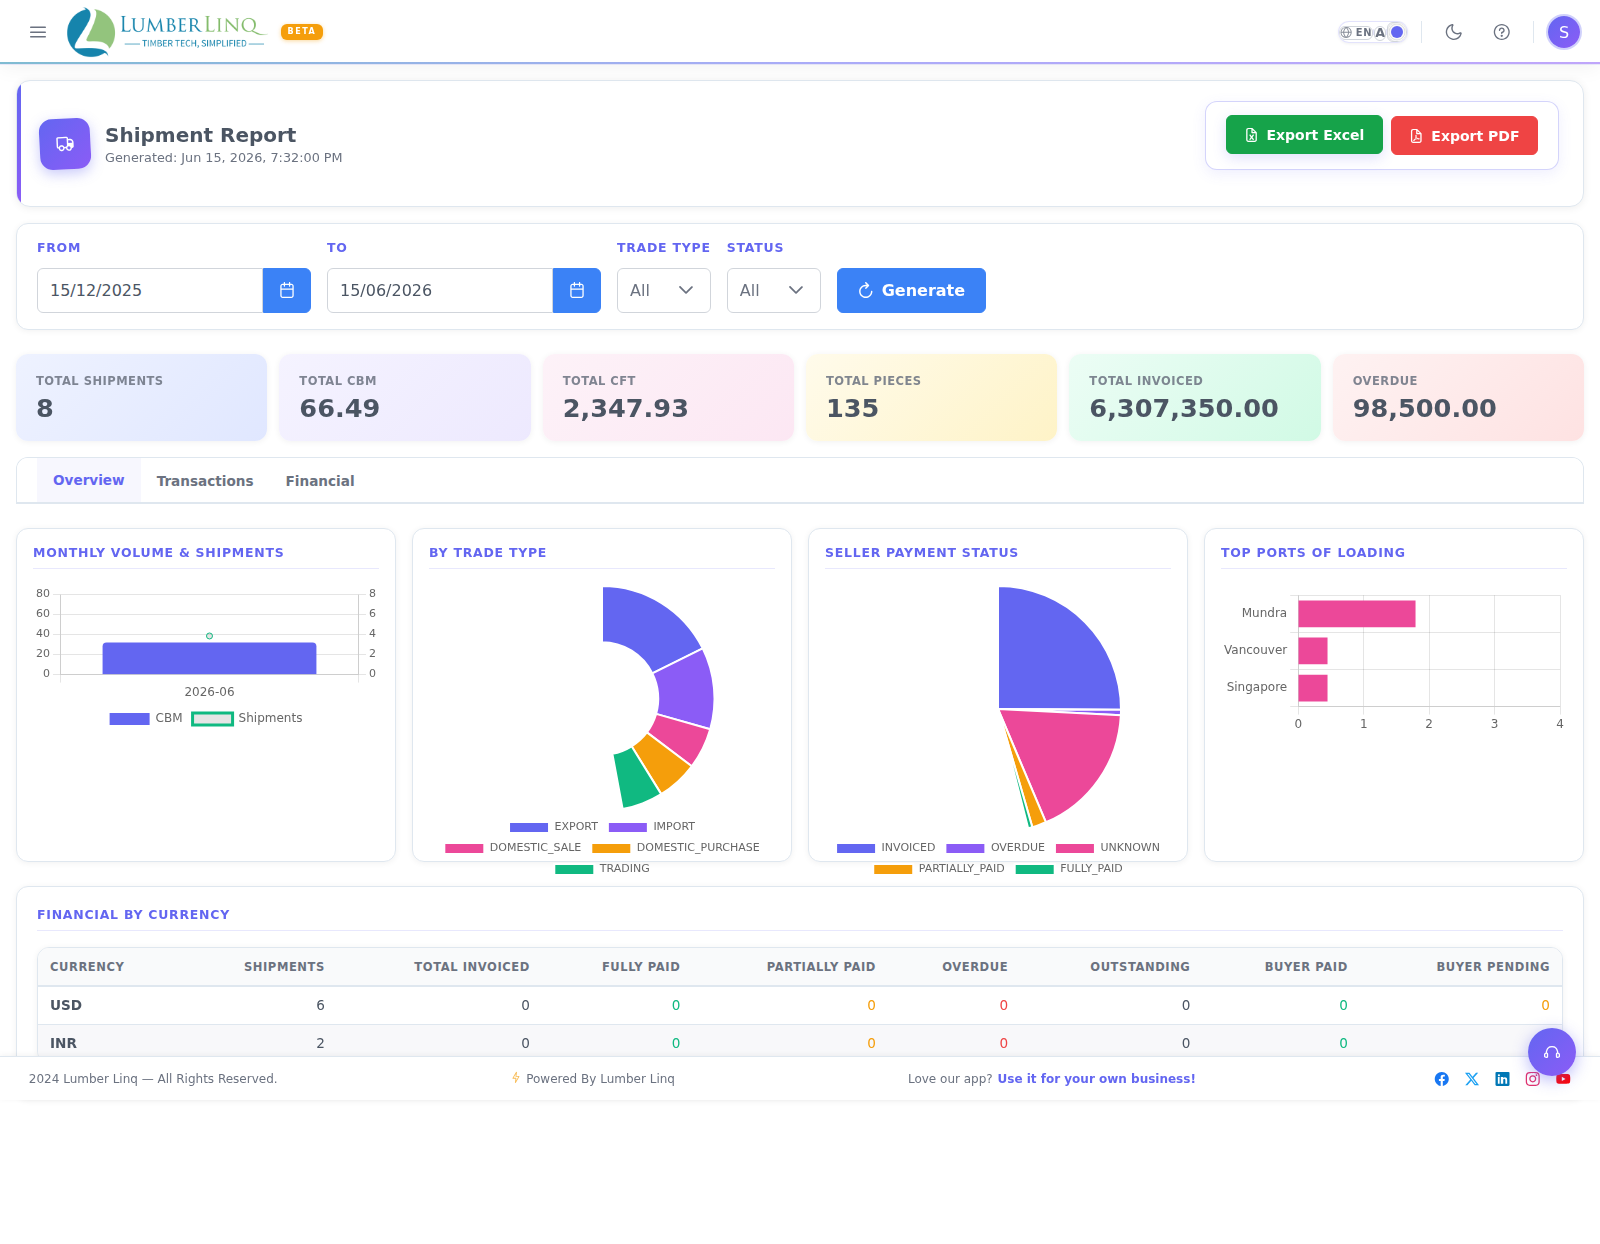
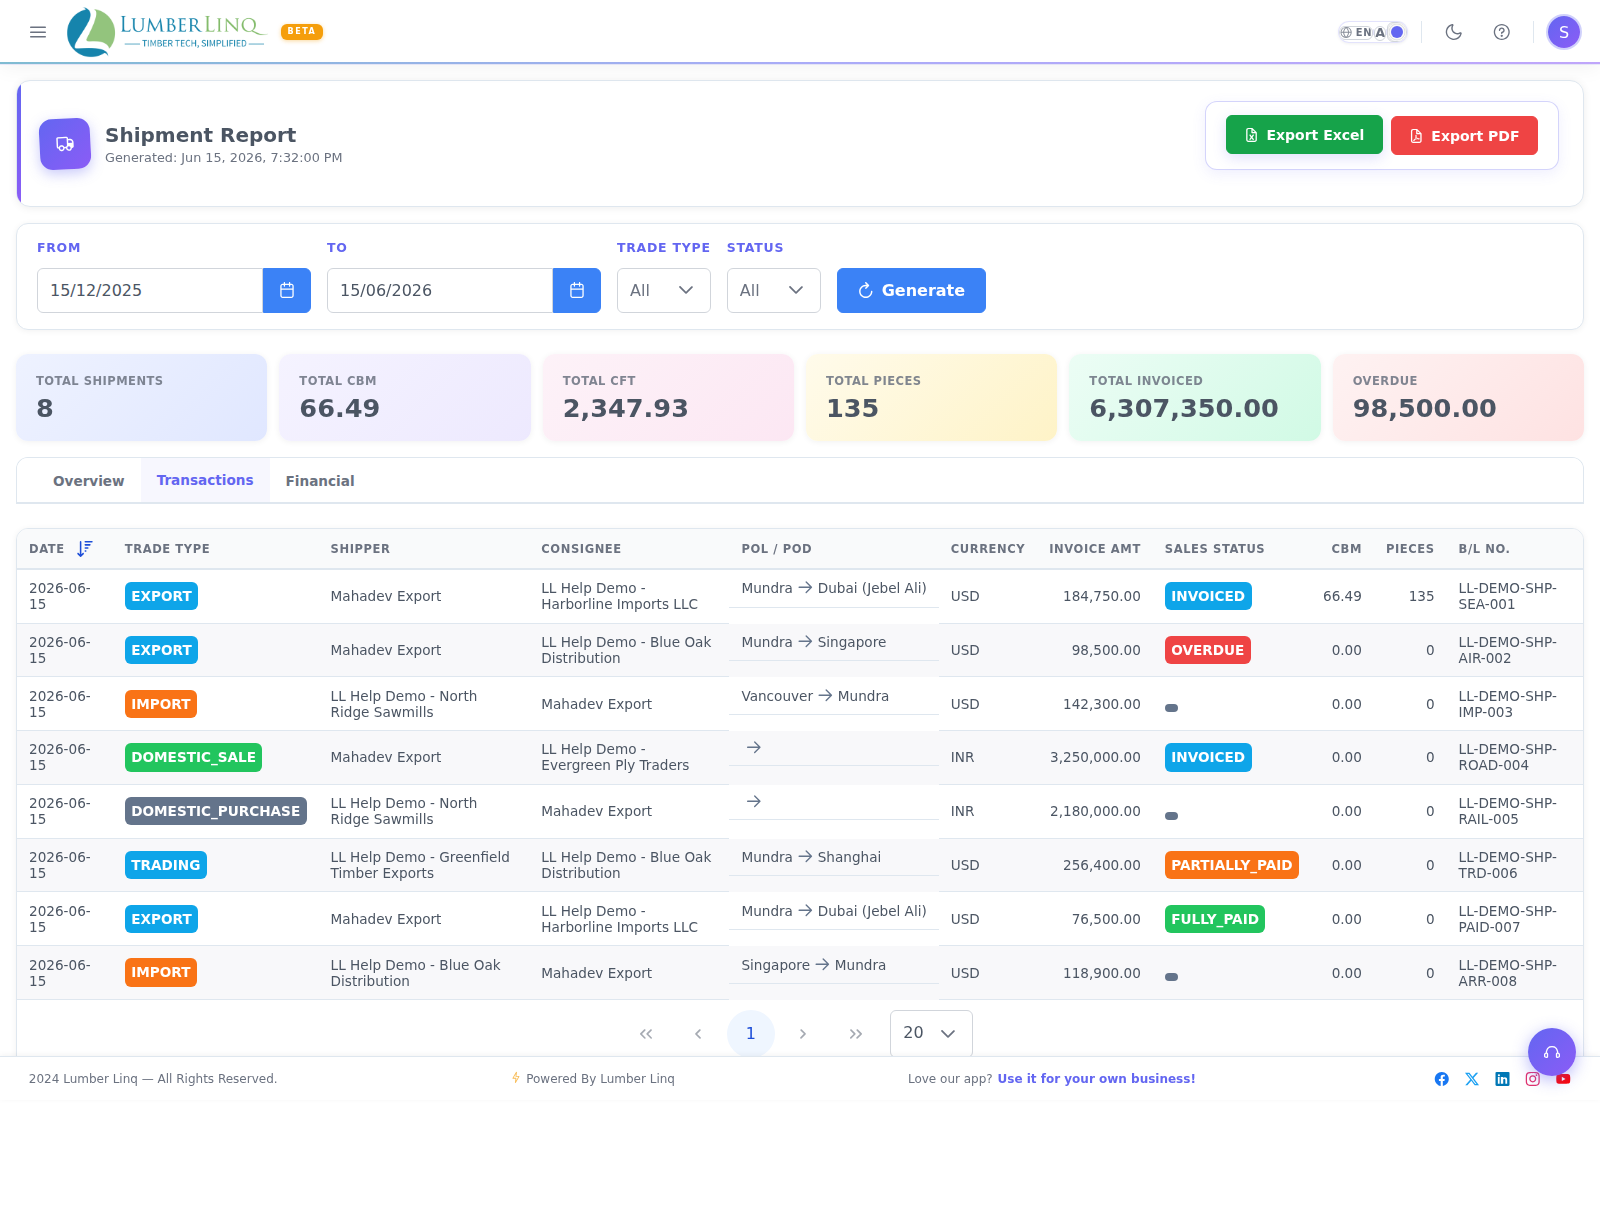
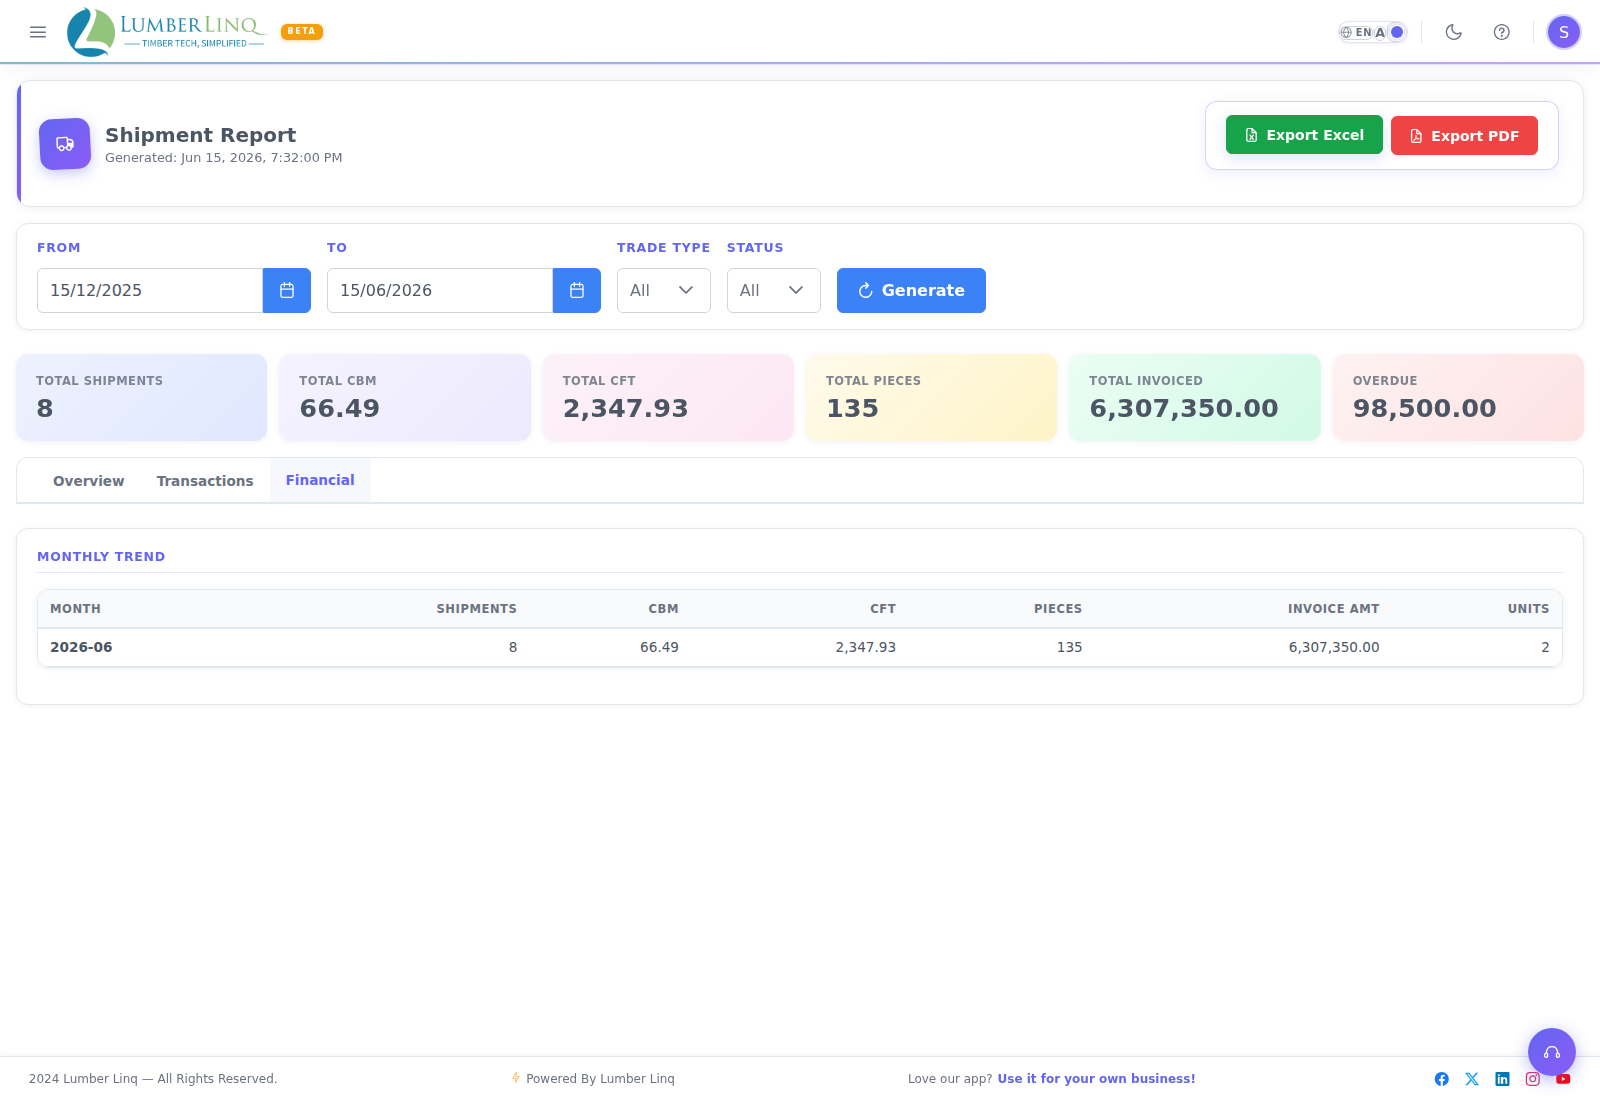
Go to Reports > Consignment (older links may still say “Shipment”). Filter by date range, trade type, and status, then click Generate.
KPI cards show Total Shipments, Total CBM, Total CFT, Total Pieces, Total Invoiced, and Overdue (only shown when there’s an overdue amount). Multi-currency totals are withheld with a dash the same way as the Business Partner Report when an exchange rate is missing. Three tabs:
- Overview — monthly volume chart, trade-type breakdown, seller payment-status pie, top loading ports chart, and a financial-by-currency table.
- Transactions — every consignment (date, trade type, shipper, consignee, port of loading → port of discharge, currency, invoice amount, sales payment status, CBM, pieces, BL number).
- Financial — a monthly trend table (shipments, CBM, CFT, pieces, invoice amount, unit count).
Financial Report
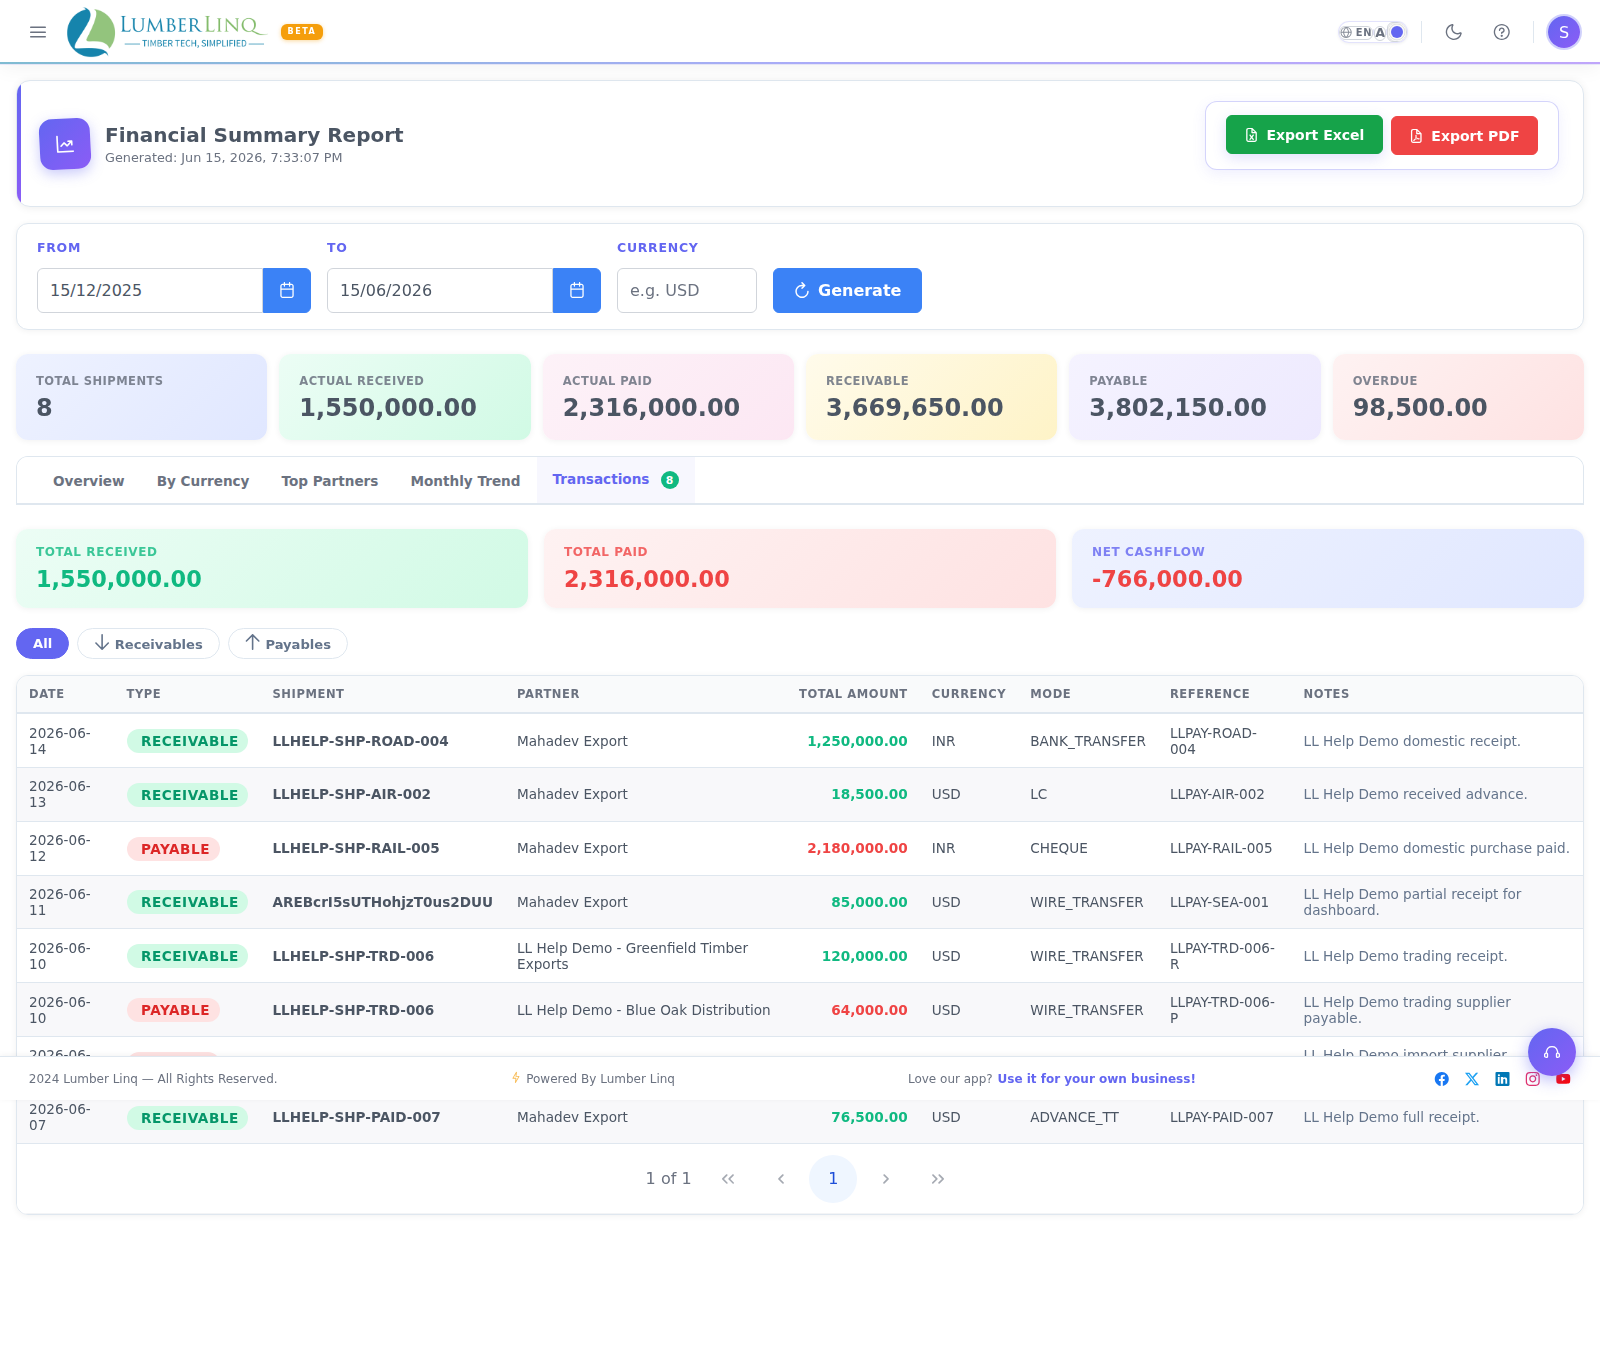
Go to Reports > Financial. Filter by date range and, optionally, a specific currency code, then click Generate.
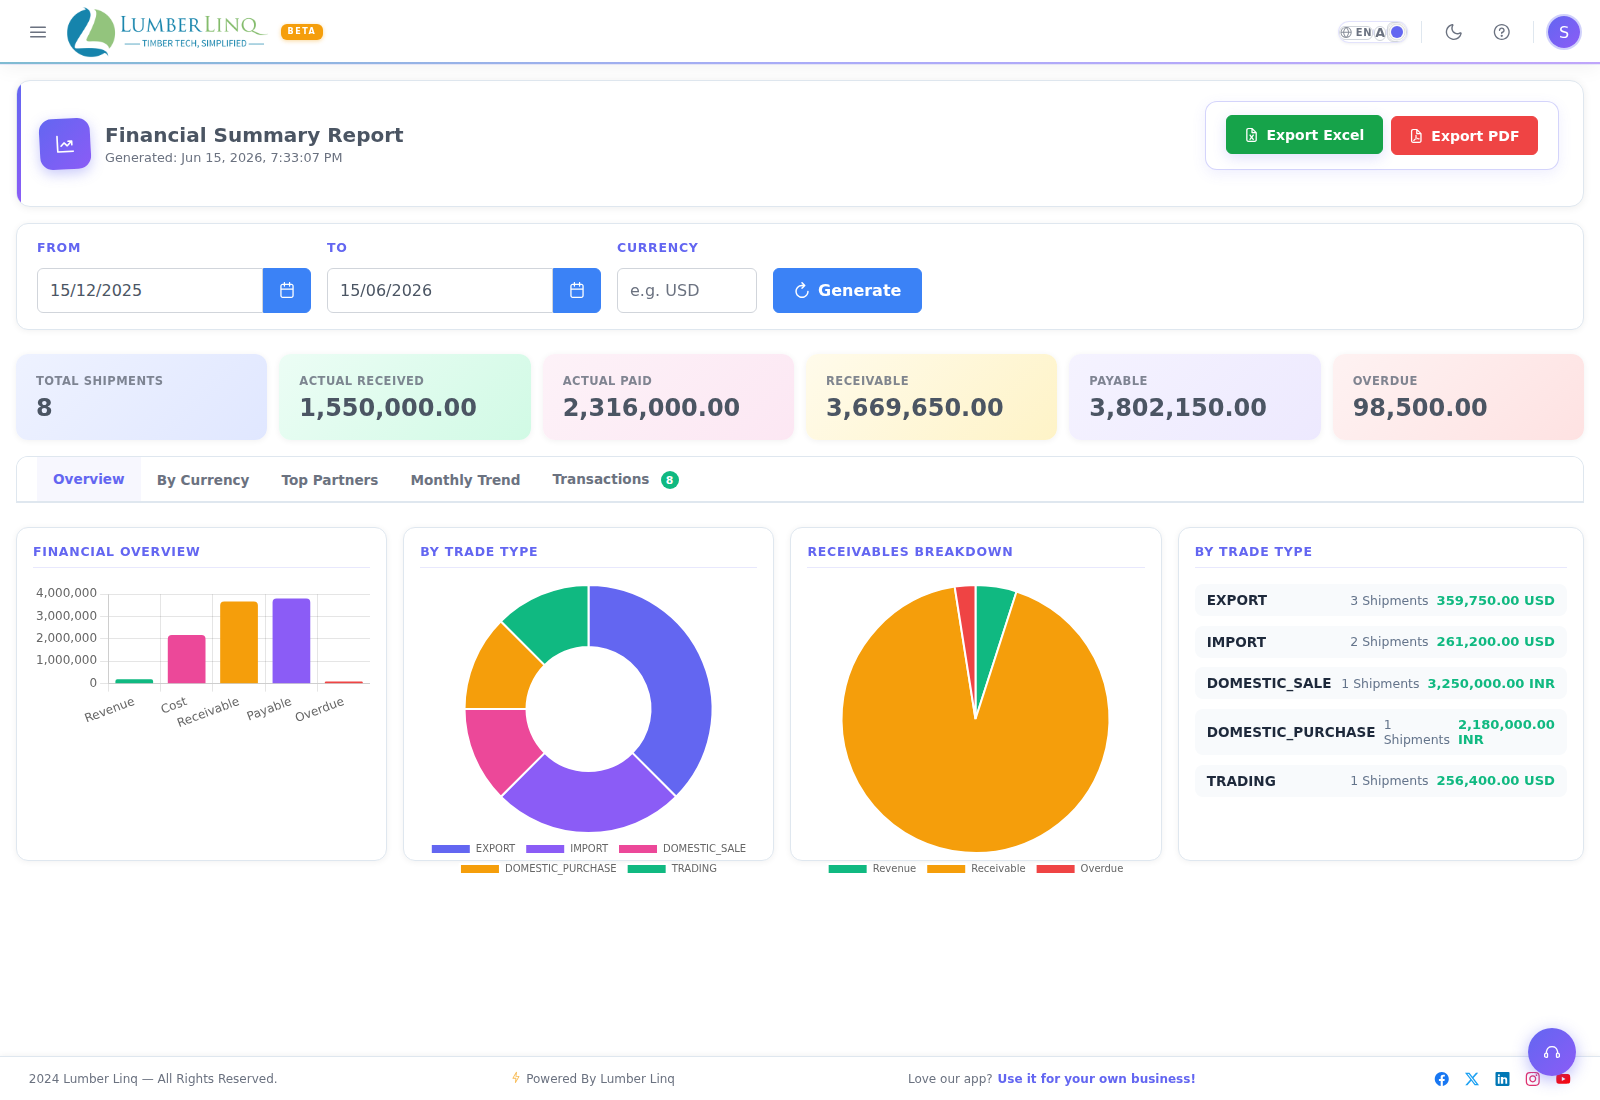
KPI cards show Total Shipments, Actual Received, Actual Paid, Receivable, Payable, and Overdue — again withheld with a dash for a blended multi-currency total if any rate is missing. Five tabs:
- Overview — a revenue/cost chart, a by-trade-type breakdown, a receivables breakdown, and a trade-type summary list.
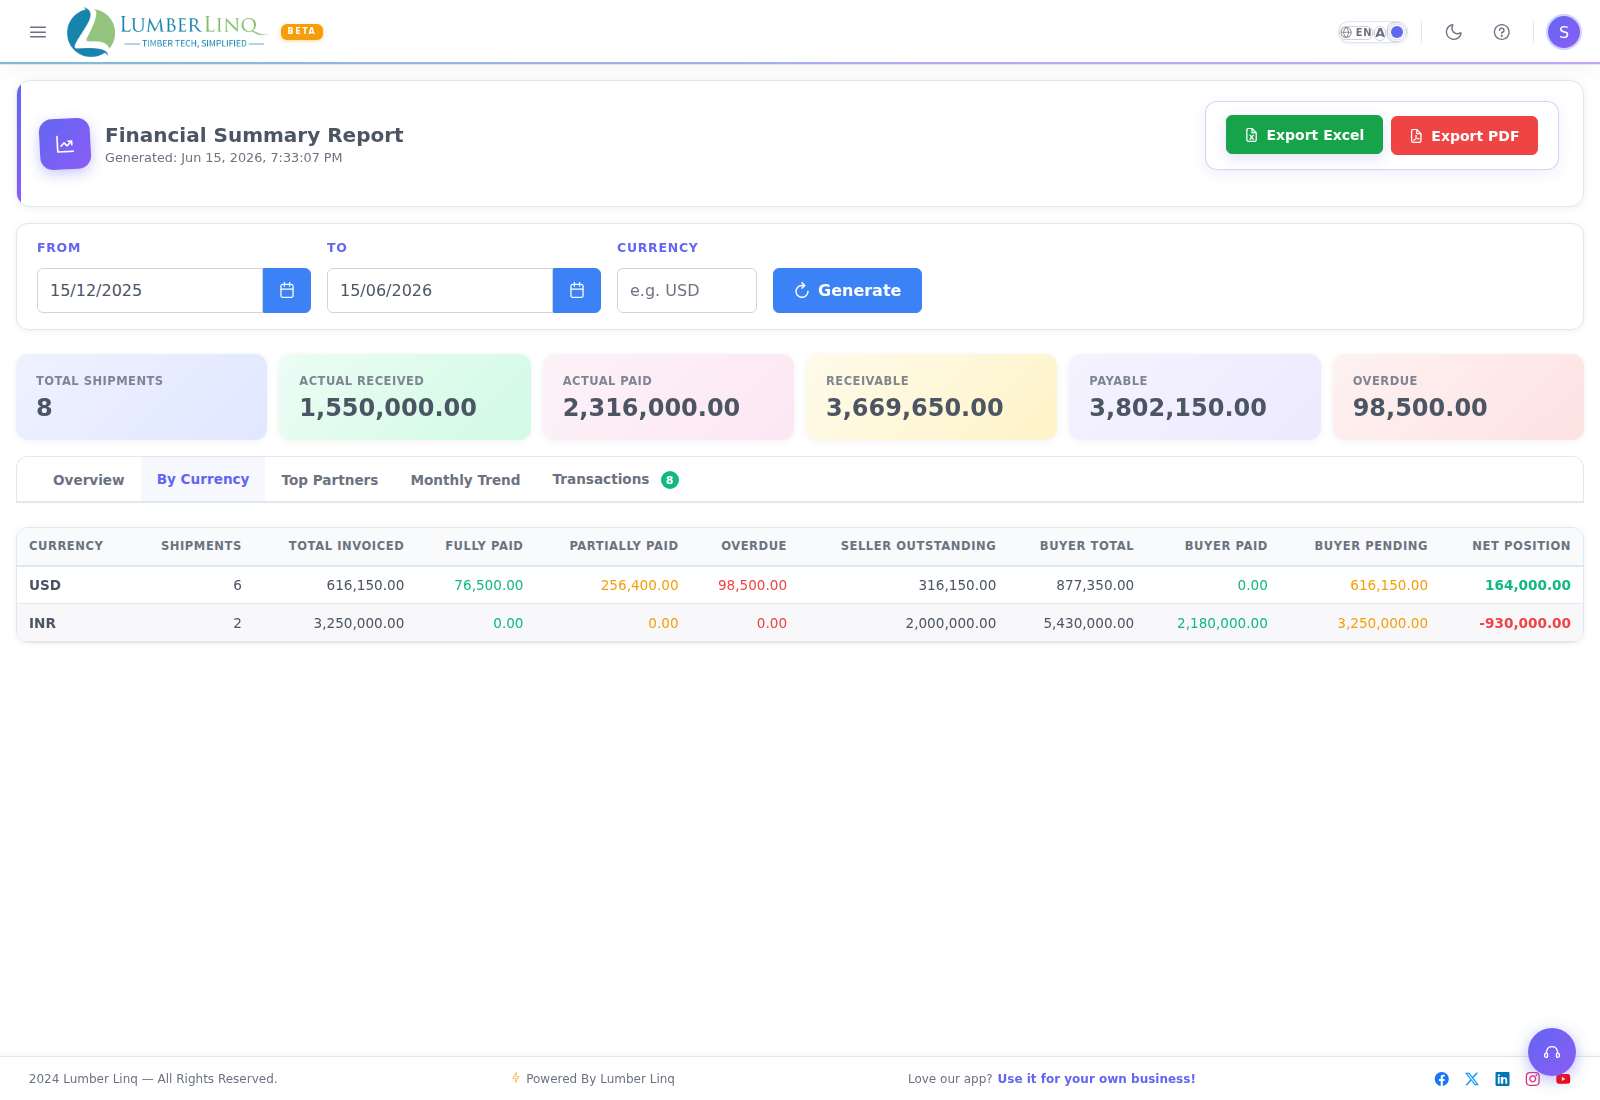
- By Currency — one row per currency: shipments, total invoiced, fully paid, partially paid, overdue, seller outstanding, buyer total/paid/pending, and net position.
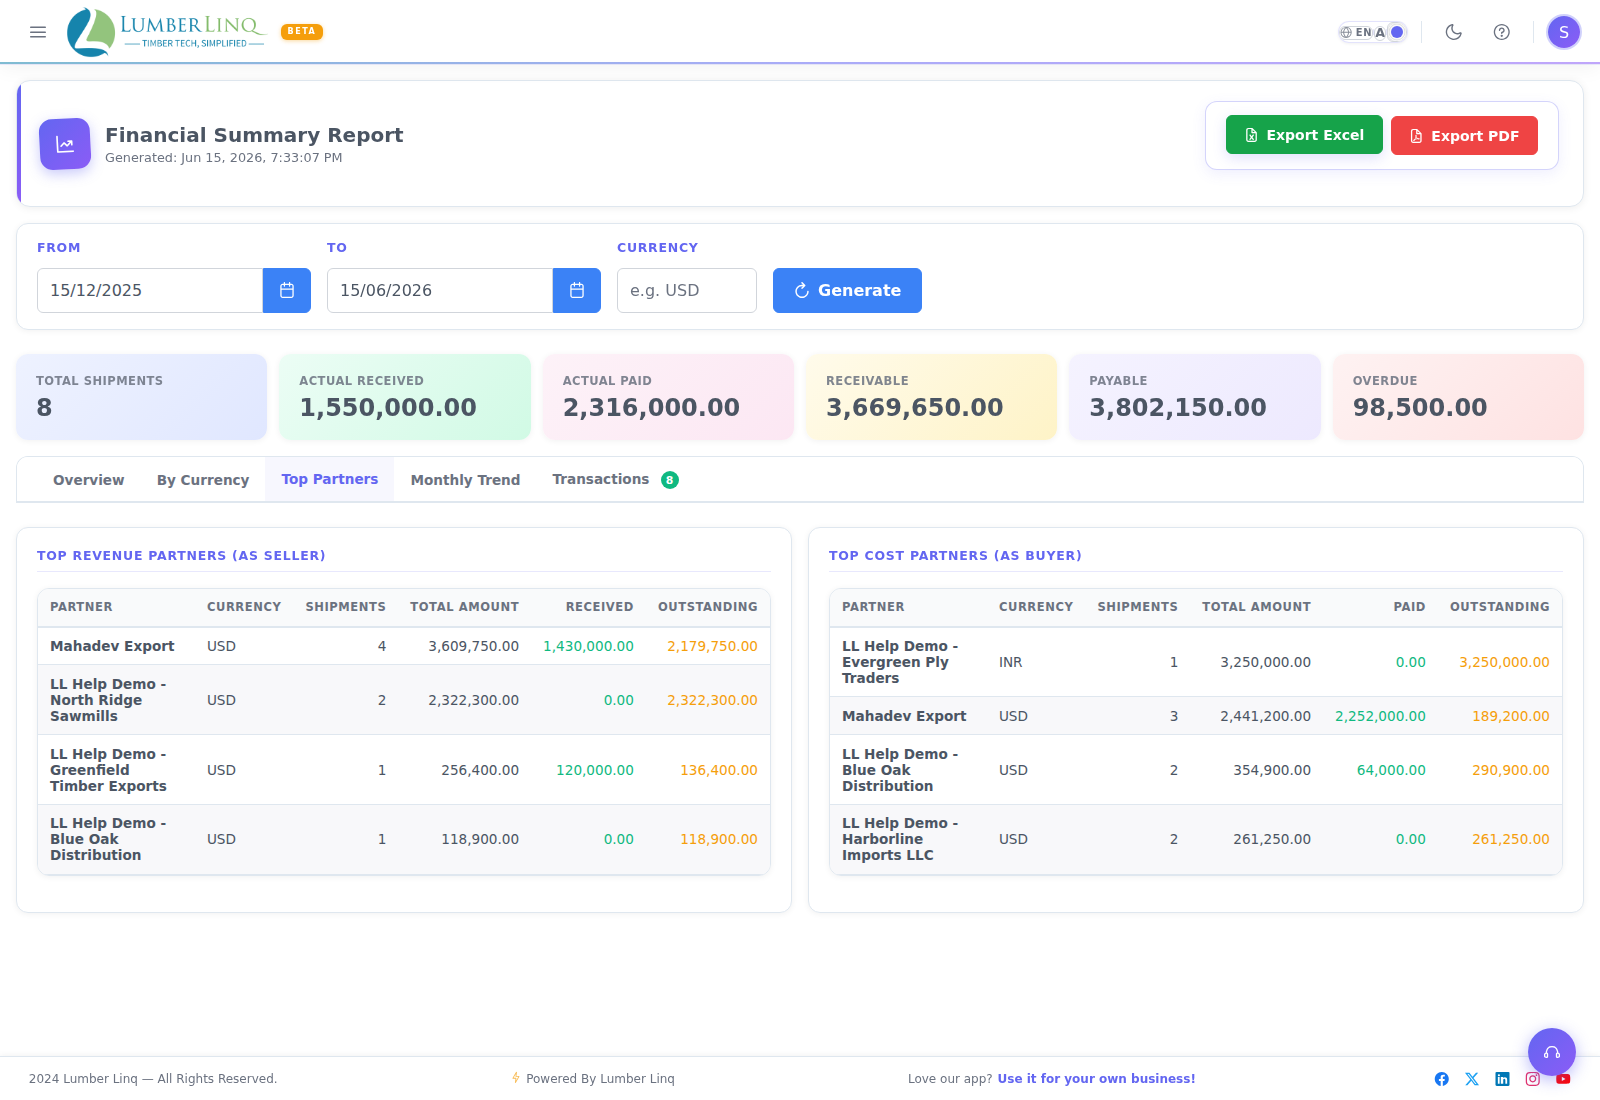
- Partners — Top Revenue Partners and Top Cost Partners tables.
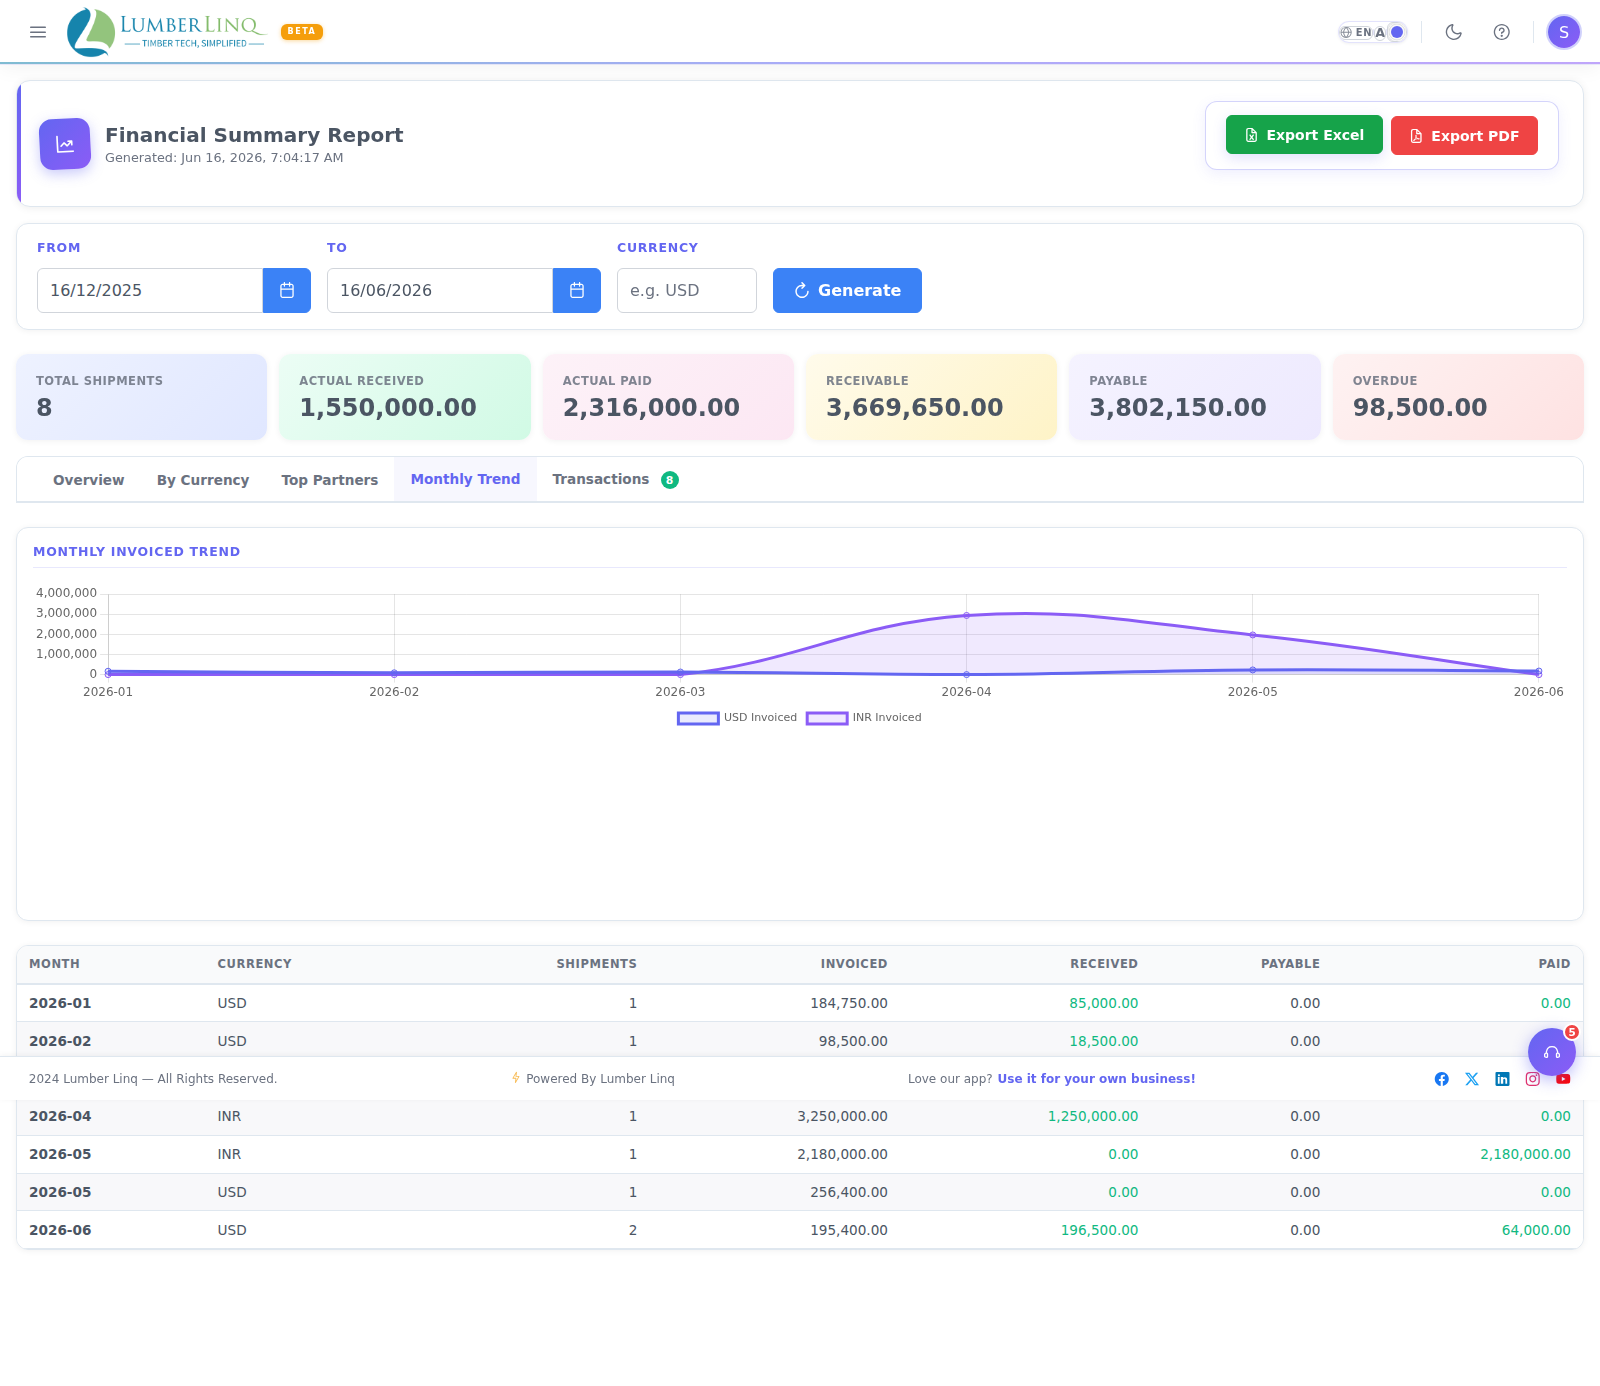
- Trend — a monthly invoiced-amount chart plus a matching table.
- Transactions — every payment record, with Receivable/Payable quick filters and extra filters for amount range, payment status, and payment date. Shows date, type, shipment, partner, amount, currency, payment mode, reference number, and notes.

Inventory Report
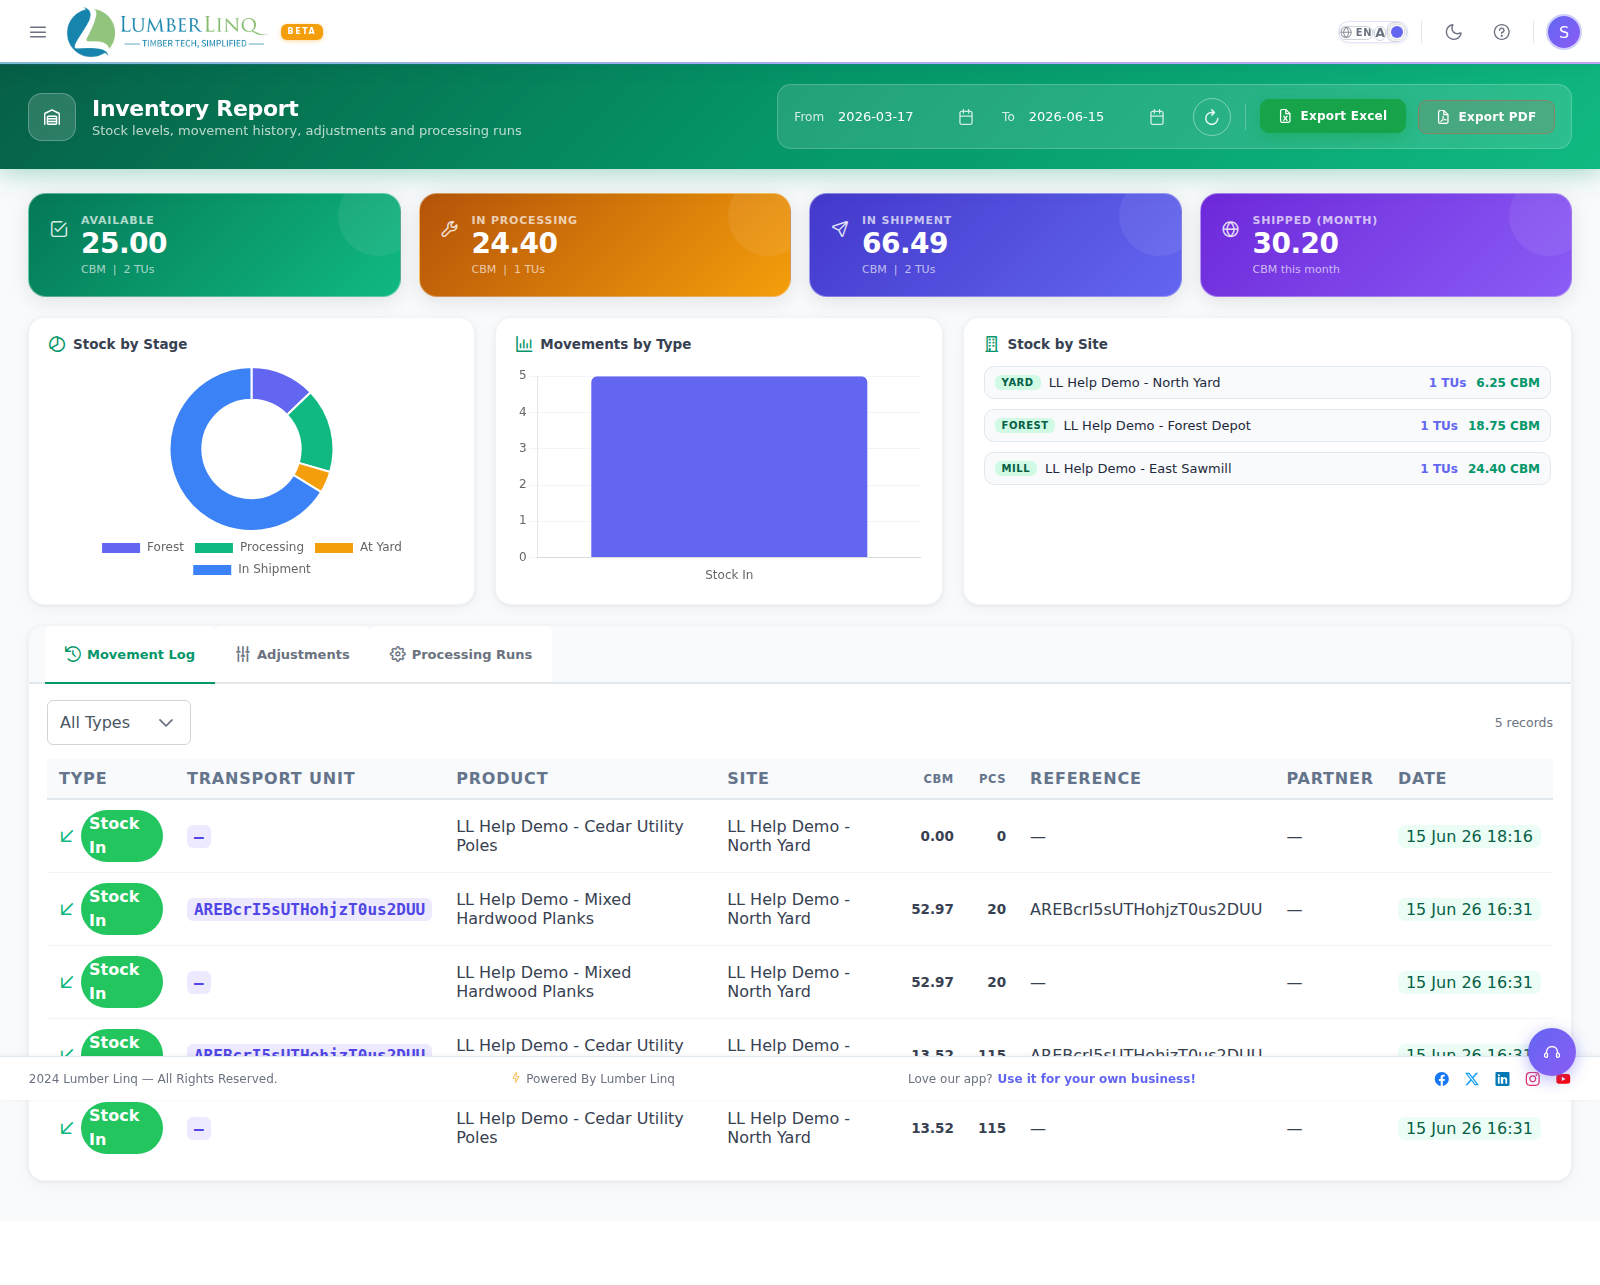
Go to Reports > Inventory. This report only appears if the Inventory module is turned on for your account — it isn’t a permission, it’s a module switch tied to your plan/add-ons, so it may simply be absent from your Reports menu on lower plans.
Filter by date range. The KPI strip shows Available CBM, Open Lots (available stock net of anything already reserved for a consignment), In Processing, In Consignment, and Shipped This Month. Charts show a Stock by Stage breakdown, Movements by Type, and a Stock by Site list (which also flags any pending Custom-Made/re-saw work at that site). Three tabs:
- Movement Log — every stock movement (IN/OUT/adjustment), filterable by movement type.
- Adjustments — manual stock corrections only.
- Processing Runs — mill re-saw runs, with run code, status, mill site, input/output/loss CBM, and outturn %.
Operators Report
Go to Reports > Operators. Like the Inventory Report, this one only appears if the Inventory module is turned on for your account.
Filter by date range and click Generate. KPI cards show Total Operators, Active Operators, Runs Completed, Total Output CBM, and Average Outturn %. The table lists each mill operator: name, employee code, specializations, active status, runs completed, input/output CBM, average and best outturn %, and average run duration in hours.
Export is Excel only — there’s no PDF button on this report. (No screenshot of this report is available in this KB yet.)
Excel Exports With Charts
Separately from the Reports module’s own Excel buttons, the Export dialog you open from a Consignment or a Stock Unit/Tally Sheet screen (see the Consignments and Tally Sheets guides) has a Charts & Stats option. Turning it on adds bar charts for Net CBM and Net CFT per Stock Unit directly into the Excel workbook, along with a size-distribution table (range, count, %, net CBM, % of volume, average CBM per piece). This only shows up when there’s more than one Stock Unit to chart — with just one unit, there’s nothing to compare, so the chart is skipped.
Full Report PDF
Two screens offer a one-click, single-record PDF that’s separate from anything in the Reports module:
- Consignment Full Report — on a consignment’s edit screen (in update mode), click Full Report to download a complete PDF covering that consignment’s details, parties, Stock Units, and financials.
- Stock Unit Full Report — from the Stock Unit list or its view screen, click the PDF icon to download a Full Report PDF for that single Stock Unit and its tally data.
Both are generated on demand and download directly — there’s nothing to configure beforehand.
Mobile View
Reports are responsive. On smaller screens, KPI cards stack, charts resize, and tables scroll horizontally so all columns stay reachable.